library(ggplot2) #加载ggplot2包
library(dplyr) #加载dplyr包
library(ggpmisc) #加载ggpmisc包
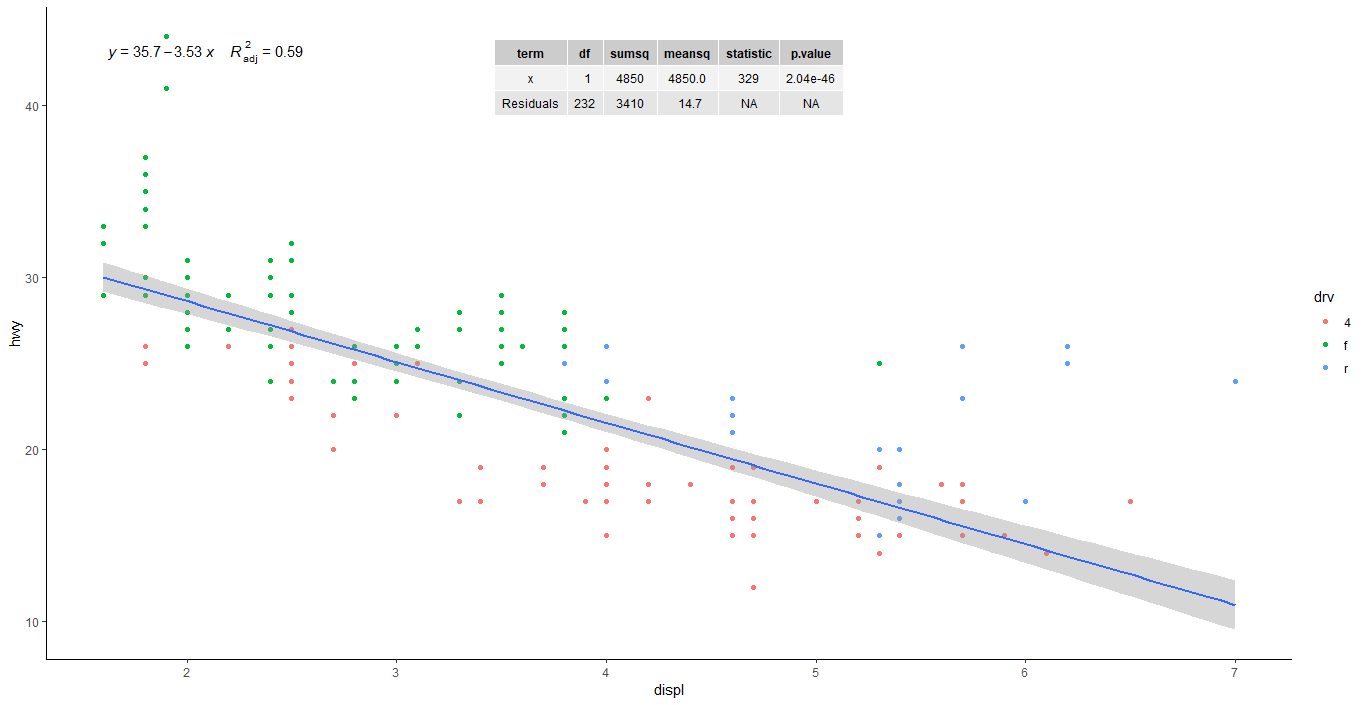
mpg %>% ggplot(aes(x = displ, y = hwy)) + geom_point(aes(color = drv)) + #以drv为分组设置点的颜色geom_smooth(method = 'lm', formula = y ~ x) + #绘制回归直线stat_poly_eq(aes(label = paste(..eq.label.., ..adj.rr.label.., sep = '~~~~')), formula = y ~ x, parse = T) + #添加回归方程和调整R方stat_fit_tb(tb.type = 'fit.anova') + #添加方差分析表theme_classic() #设置主题为classic

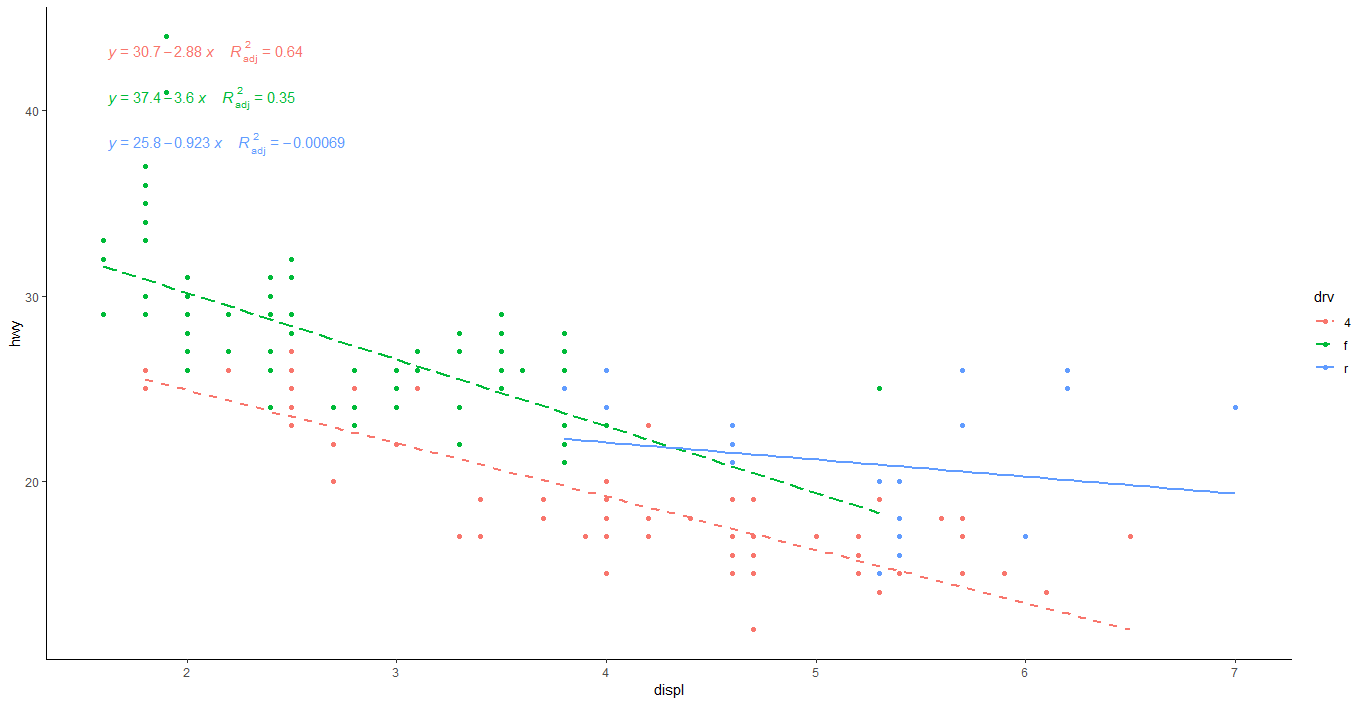
mpg %>% ggplot(aes(x = displ, y = hwy, color = drv, linetype = drv)) +#以drv为分组设置点的颜色和线条类型 geom_point() + geom_smooth(method = 'lm', formula = y ~ x, se = F) + #绘制回归直线stat_poly_eq(aes(label = paste(..eq.label.., ..adj.rr.label.., sep = '~~~~')), formula = y ~ x, parse = T) + #添加回归方程和调整R方scale_linetype_manual(values = c('dashed', 'longdash', 'solid')) + #自定义回归直线的类型theme_classic() #设置主题为classic


