本博文来自于网络收集,如有侵权请联系删除
三维图绘制
- 1 三维散点图
- 2 三维柱状图
- 三维曲面
1 三维散点图
import matplotlib.pyplot as plt
import numpy as npfrom mpl_toolkits.mplot3d import Axes3Dfig = plt.figure()
# ax = fig.gca(projection="3d")
ax = fig.add_axes(Axes3D(fig))xs = np.random.rand(50)*10
ys = np.random.rand(50)*10+20
zs1 = np.random.rand(50)*10
zs2 = np.sqrt(xs**2+ys**2)ax.scatter(xs, ys, zs=zs1, zdir="z", c="c", marker="o", s=30)
ax.scatter(xs, ys, zs=zs2, zdir="z", c="purple", marker="<", s=30)ax.set(xlabel="X", ylabel="Y", zlabel="Z")plt.show()

2 三维柱状图
import matplotlib.pyplot as plt
import numpy as npfig = plt.figure()
ax = fig.add_subplot(1, 1, 1, projection="3d")colorsList = ["r", "b", "y"]
yLayersList = [2, 1, 0]for color, layer in zip(colorsList, yLayersList):x = np.arange(10)y = np.random.rand(10)ax.bar(x, y, zs=layer, zdir="y", color=color, alpha=.7)ax.set(xlabel="X", ylabel="Y", zlabel="Z", yticks=yLayersList)plt.show()

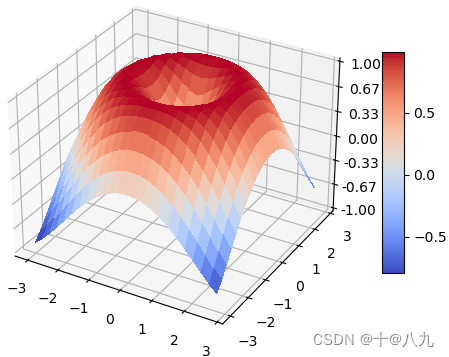
三维曲面
import matplotlib.pyplot as plt
import numpy as npfrom matplotlib import cm
from matplotlib.ticker import LinearLocator,FormatStrFormatterfig = plt.figure()
ax = fig.add_subplot(1, 1, 1, projection="3d")x = np.arange(-3, 3, 0.25)
y = np.arange(-3, 3, 0.25)
x, y = np.meshgrid(x, y)
r = np.sqrt(np.power(x, 2) + np.power(y, 2))
z = np.sin(r)surf = ax.plot_surface(x, y, z,rstride=1,cstride=1,cmap=cm.coolwarm,linewidth=0,antialiased=False)ax.set(zlim=(-1, 1))
ax.zaxis.set_major_locator(LinearLocator(7))
ax.zaxis.set_major_formatter(FormatStrFormatter("%3.2f"))fig.colorbar(surf, shrink=0.6, aspect=10)plt.show()



![[BT]BUUCTF刷题第6天(3.24)](https://img-blog.csdnimg.cn/direct/a0b2b2c123d146f0bf6c1177fe622ab0.png)
