文章目录
- 前言
- 一、Apisix部署
- 二、安装配置Grafana
- 1. 安装Grafana
- 2. 设置中文
- 3. 启动
- 4. 登录
- 5. 启停命令
- 5.1 启动和停止
- 5.2 启禁用开机自启动
- 5.3 查看状态
- 三、安装配置prometheus
- 1. 安装
- 2. 配置服务
- 3. 启动
- 4. 登录
- 5. prometheus启停命令
- 5.1 启动和停止
- 5.2 启禁用开机自启动
- 5.3 查看状态
- 四、Apisix指标数据可视化
- 1. Apisix配置
- 1.1 启用Prometheus插件
- 1.2 配置指标访问
- 1.2.1 hadoop101节点
- 1.2.2 hadoop102节点
- 1.2.3 hadoop103节点
- 2. Prometheus配置
- 3. Grafana配置
- 3.1 下载Apisix指标模版文件
- 3.2 配置Prometheus数据源
- 五、嵌入Grafana到Apisix
- 1. 修改Grafana配置
- 1.1 启用匿名访问
- 1.2 允许通过 iframe 访问
- 2. 修改apisix-dashboard配置
- 3. 在Apisix中嵌入Grafana
- 总结
前言
本文介绍了Apisix的部署和配置,以及如何安装和配置Grafana与Prometheus来实现指标数据的可视化。通过阅读本文,您将了解到如何搭建多节点的Apisix环境,并使用Grafana展示Apisix的监控指标。
一、Apisix部署
Apisix多节点搭建教程
Apisix数据编辑器路由配置教程
Apisix路由配置教程
二、安装配置Grafana
1. 安装Grafana
wget https://dl.grafana.com/enterprise/release/grafana-enterprise-10.4.1-1.x86_64.rpm -P /tmp
yum install -y /tmp/grafana-enterprise-10.4.1-1.x86_64.rpm
2. 设置中文
sed -i "s|^default_language =.*|default_language = zh-Hans|" /usr/share/grafana/conf/defaults.ini
3. 启动
systemctl start grafana-server
4. 登录
浏览器访问 http://localhost:3000 登录UI页面。用户名和密码都是admin,第一次登录时要更改密码。

5. 启停命令
5.1 启动和停止
systemctl start grafana-server
systemctl restart grafana-server
systemctl stop grafana-server
5.2 启禁用开机自启动
systemctl enable grafana-server
systemctl disable grafana-server
5.3 查看状态
systemctl status grafana-server
三、安装配置prometheus
1. 安装
mkdir -p /opt/module
wget https://github.com/prometheus/prometheus/releases/download/v2.51.0/prometheus-2.51.0.linux-amd64.tar.gz -P /tmp
tar -zxvf /tmp/prometheus-2.51.0.linux-amd64.tar.gz -C /opt/module
2. 配置服务
创建/usr/lib/systemd/system/prometheus.service文件。
vim /usr/lib/systemd/system/prometheus.service
添加如下内容。
[Unit]
Description=Prometheus
Documentation=https://prometheus.io/
After=network.target[Service]
Type=simple
ExecStart=/opt/module/prometheus-2.51.0.linux-amd64/prometheus --config.file=/opt/module/prometheus-2.51.0.linux-amd64/prometheus.yml --web.listen-address=0.0.0.0:9090
ExecReload=/bin/kill -HUP $MAINPID
KillMode=process
Restart=on-failure[Install]
WantedBy=multi-user.target
3. 启动
systemctl start prometheus
4. 登录
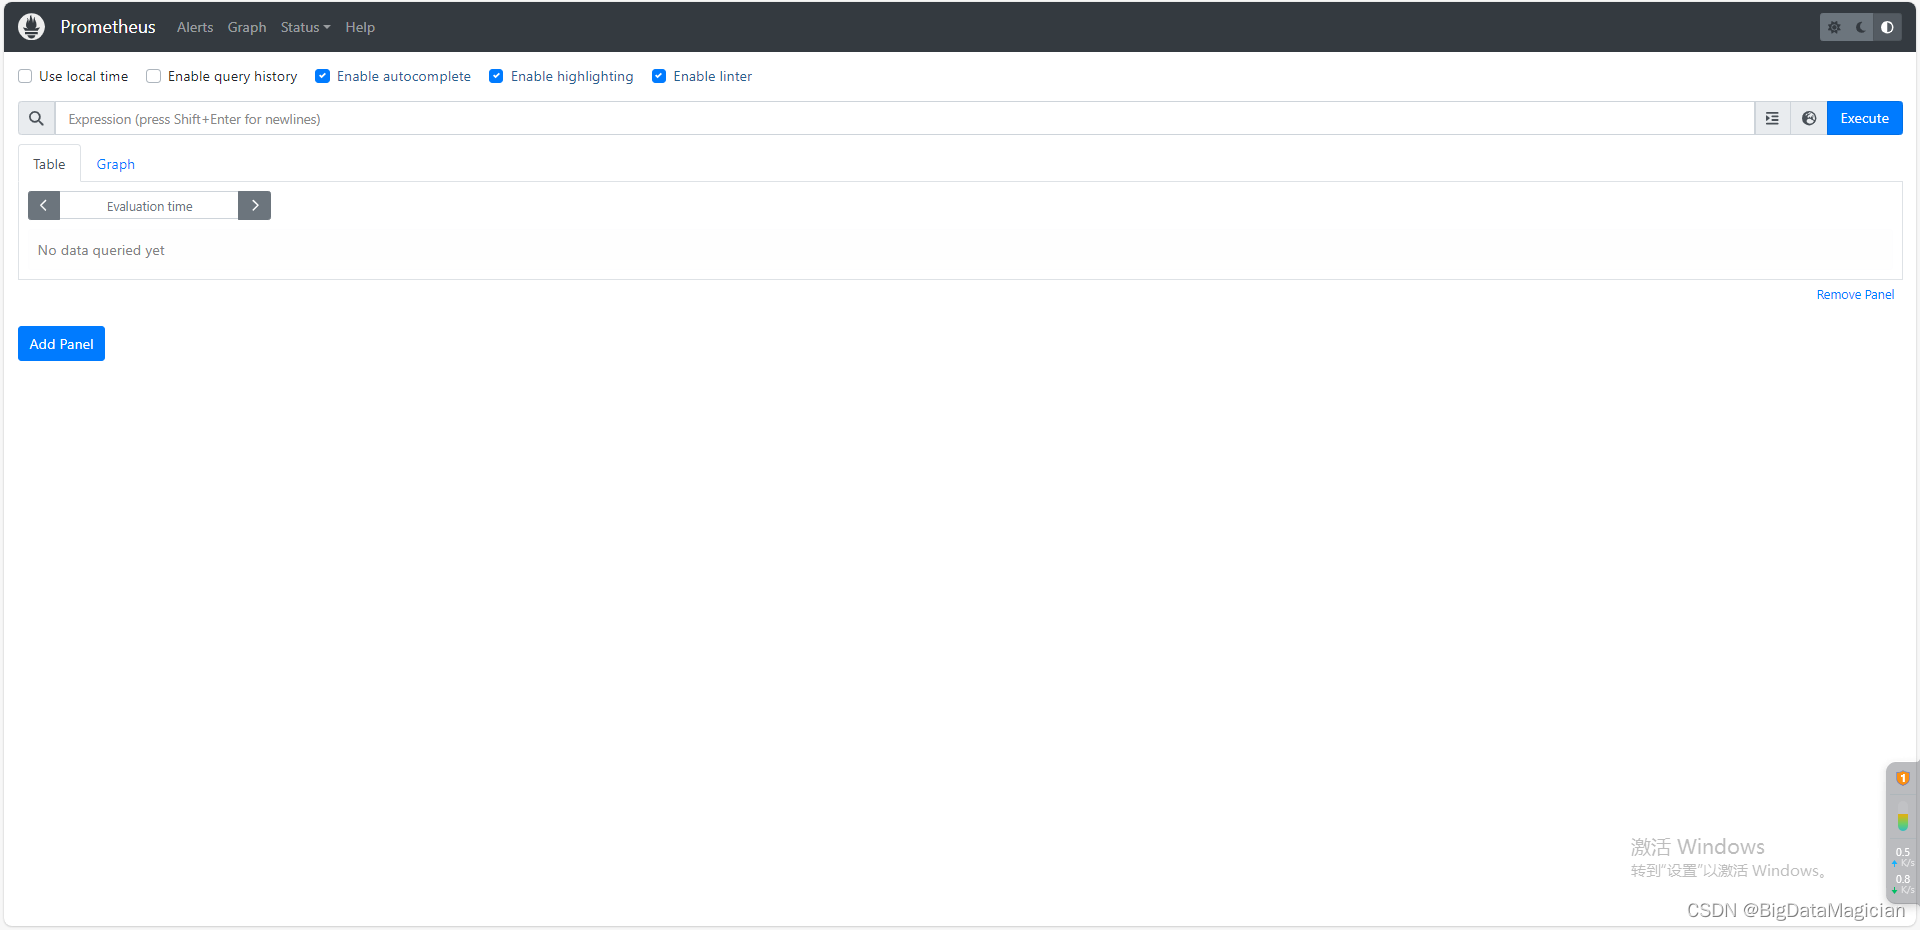
浏览器访问 http://localhost:9090 进入UI页面。
5. prometheus启停命令
5.1 启动和停止
systemctl start prometheus
systemctl restart prometheus
systemctl stop prometheus
5.2 启禁用开机自启动
systemctl enable prometheus
systemctl disable prometheus
5.3 查看状态
systemctl status prometheus
四、Apisix指标数据可视化
1. Apisix配置
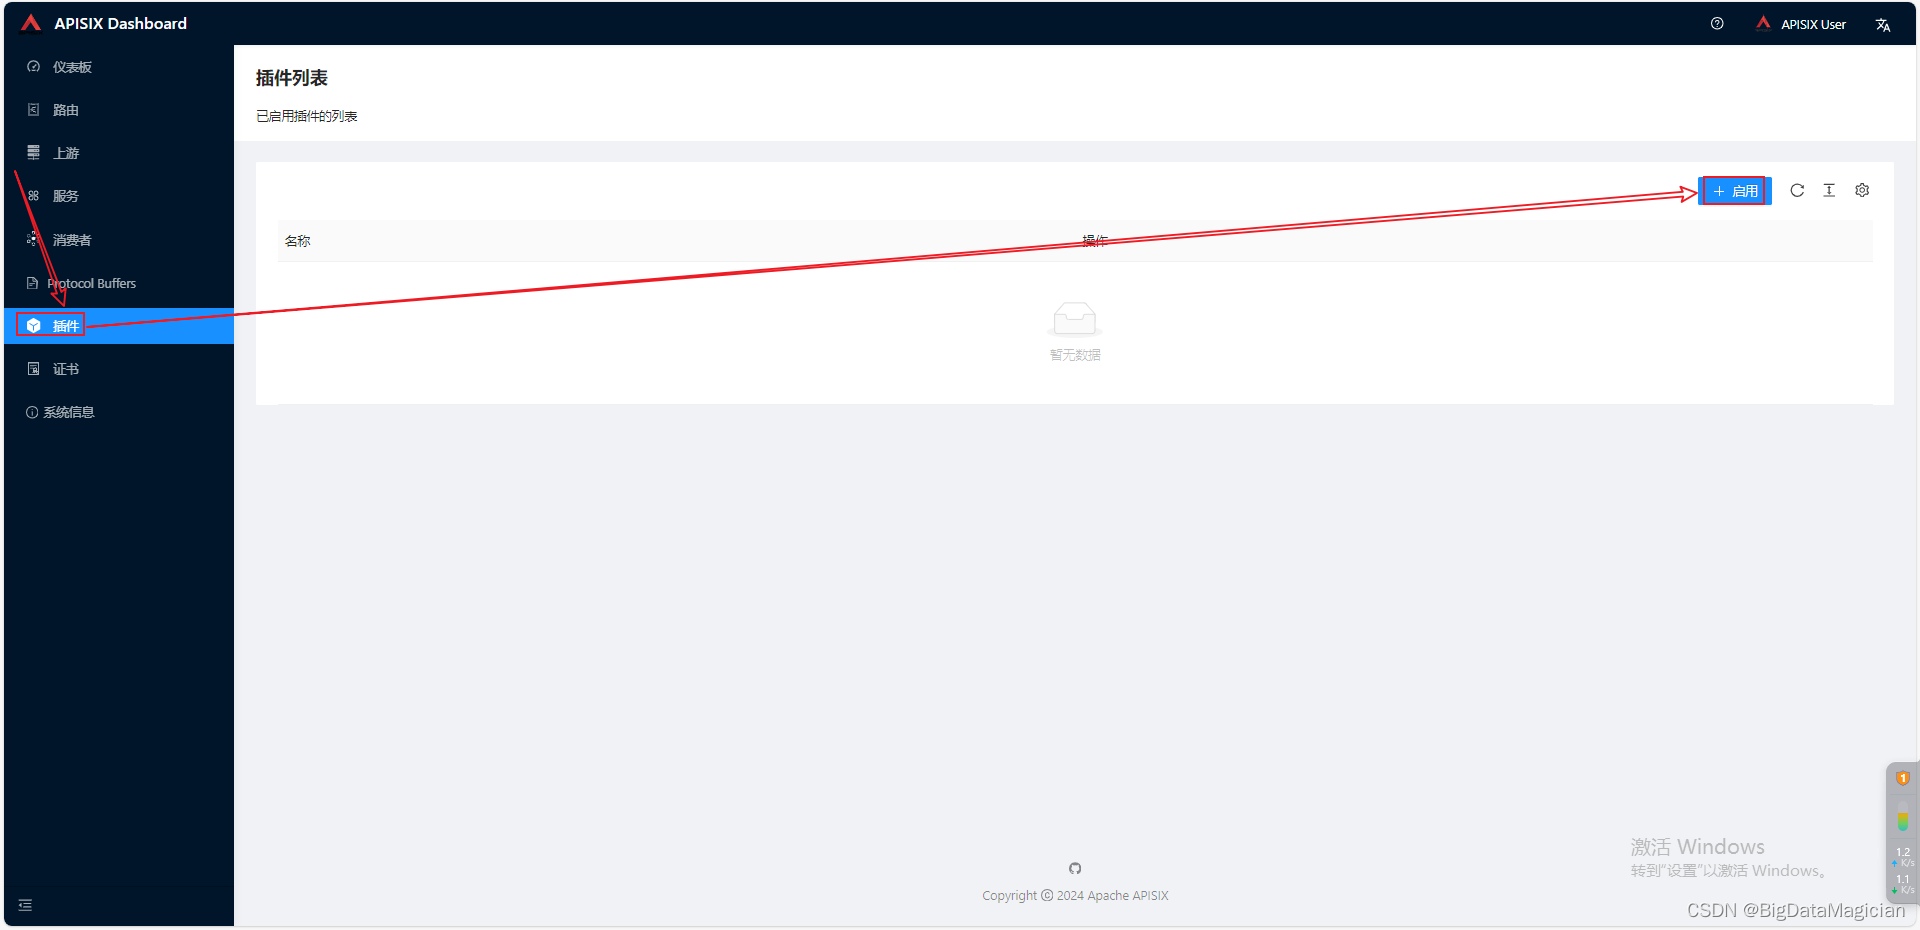
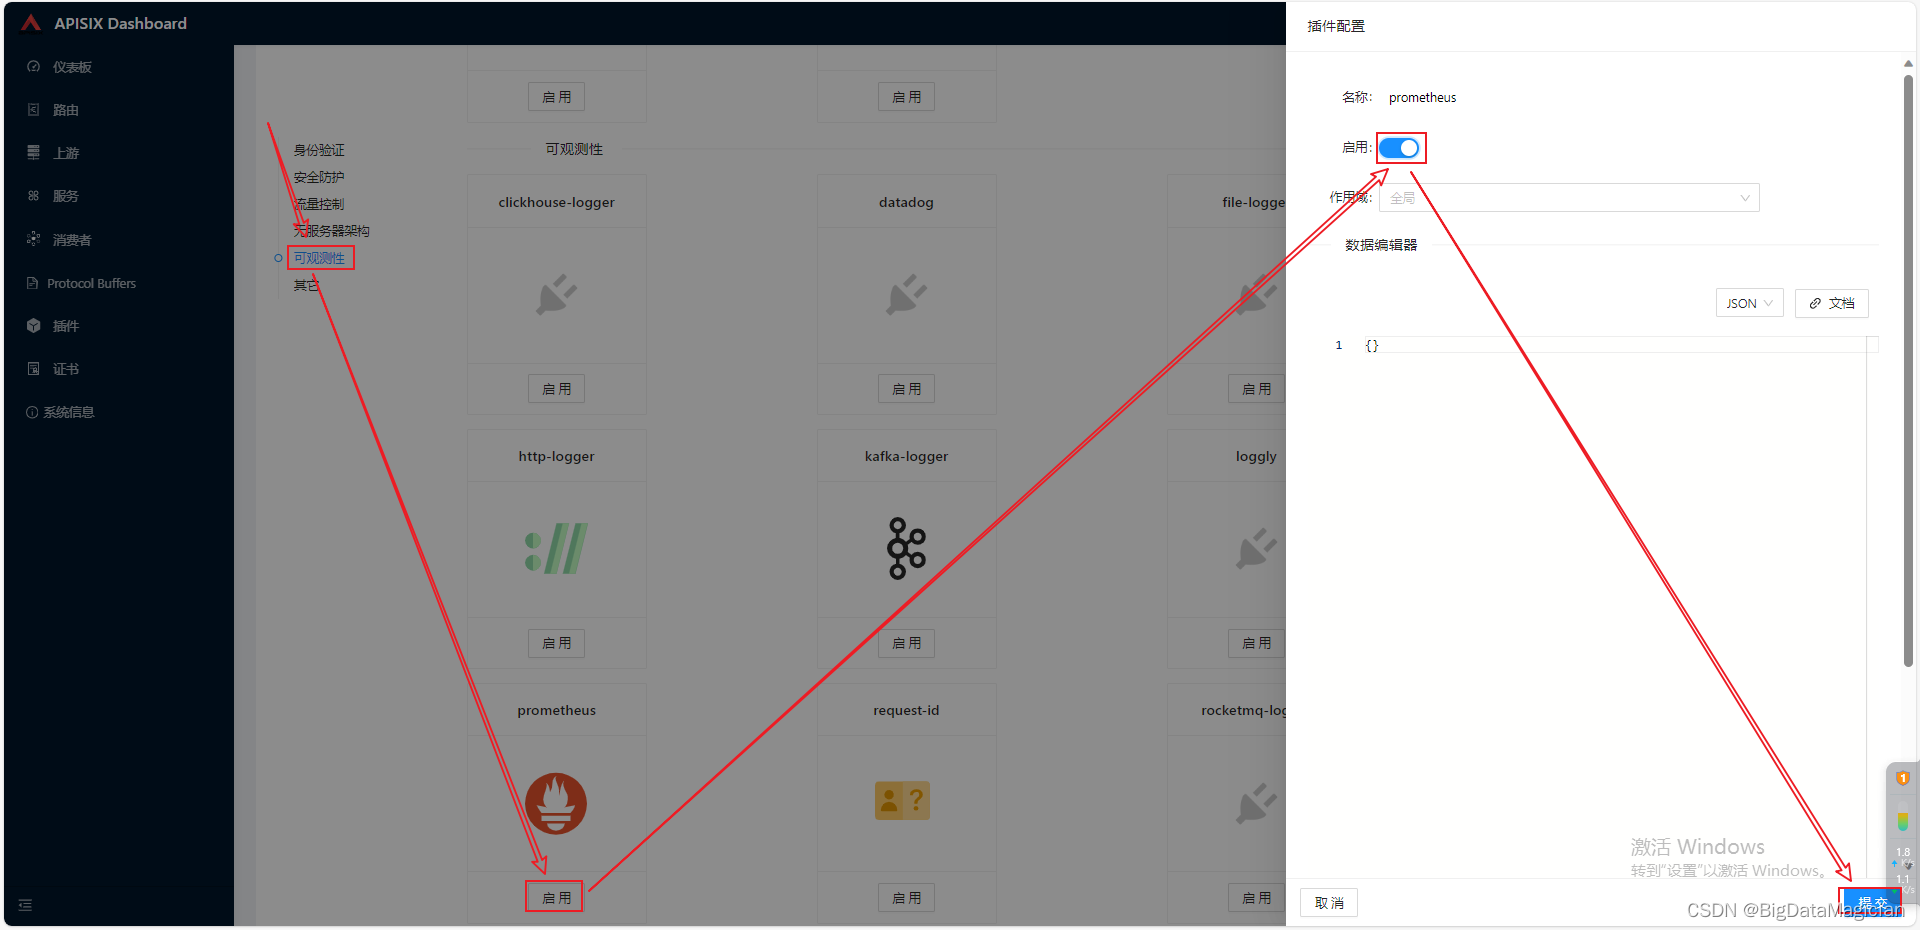
1.1 启用Prometheus插件
1.2 配置指标访问
1.2.1 hadoop101节点
修改/usr/local/apisix/conf/config.yaml文件,添加如下内容。
vim /usr/local/apisix/conf/config.yaml
添加如下配置。
plugin_attr:prometheus:export_addr:ip: 192.168.145.103port: 9091
重新加载配置文件。
ulimit -n 4096
apisix reload
验证是否可以获取指标数据。
curl -i http://192.168.145.103:9091/apisix/prometheus/metrics
1.2.2 hadoop102节点
修改/usr/local/apisix/conf/config.yaml文件,添加如下内容。
vim /usr/local/apisix/conf/config.yaml
添加如下配置。
plugin_attr:prometheus:export_addr:ip: 192.168.145.104port: 9091
重新加载配置文件。
ulimit -n 4096
apisix reload
验证是否可以获取指标数据。
curl -i http://192.168.145.104:9091/apisix/prometheus/metrics
1.2.3 hadoop103节点
修改/usr/local/apisix/conf/config.yaml文件,添加如下内容。
vim /usr/local/apisix/conf/config.yaml
添加如下配置。
plugin_attr:prometheus:export_addr:ip: 192.168.145.105port: 9091
重新加载配置文件。
ulimit -n 4096
apisix reload
验证是否可以获取指标数据。
curl -i http://192.168.145.105:9091/apisix/prometheus/metrics
2. Prometheus配置
修改/opt/module/prometheus-2.51.0.linux-amd64/prometheus.yml文件,添加如下内容。
vim /opt/module/prometheus-2.51.0.linux-amd64/prometheus.yml
scrape_configs:# The job name is added as a label `job=<job_name>` to any timeseries scraped from this config.- job_name: "prometheus"# metrics_path defaults to '/metrics'# scheme defaults to 'http'.static_configs:- targets: ["localhost:9090"]- job_name: 'apisix'scrape_interval: 10smetrics_path: '/apisix/prometheus/metrics'static_configs:- targets: ['192.168.145.103:9091', '192.168.145.104:9091', '192.168.145.105:9091']
重启Prometheus服务。
systemctl restart prometheus
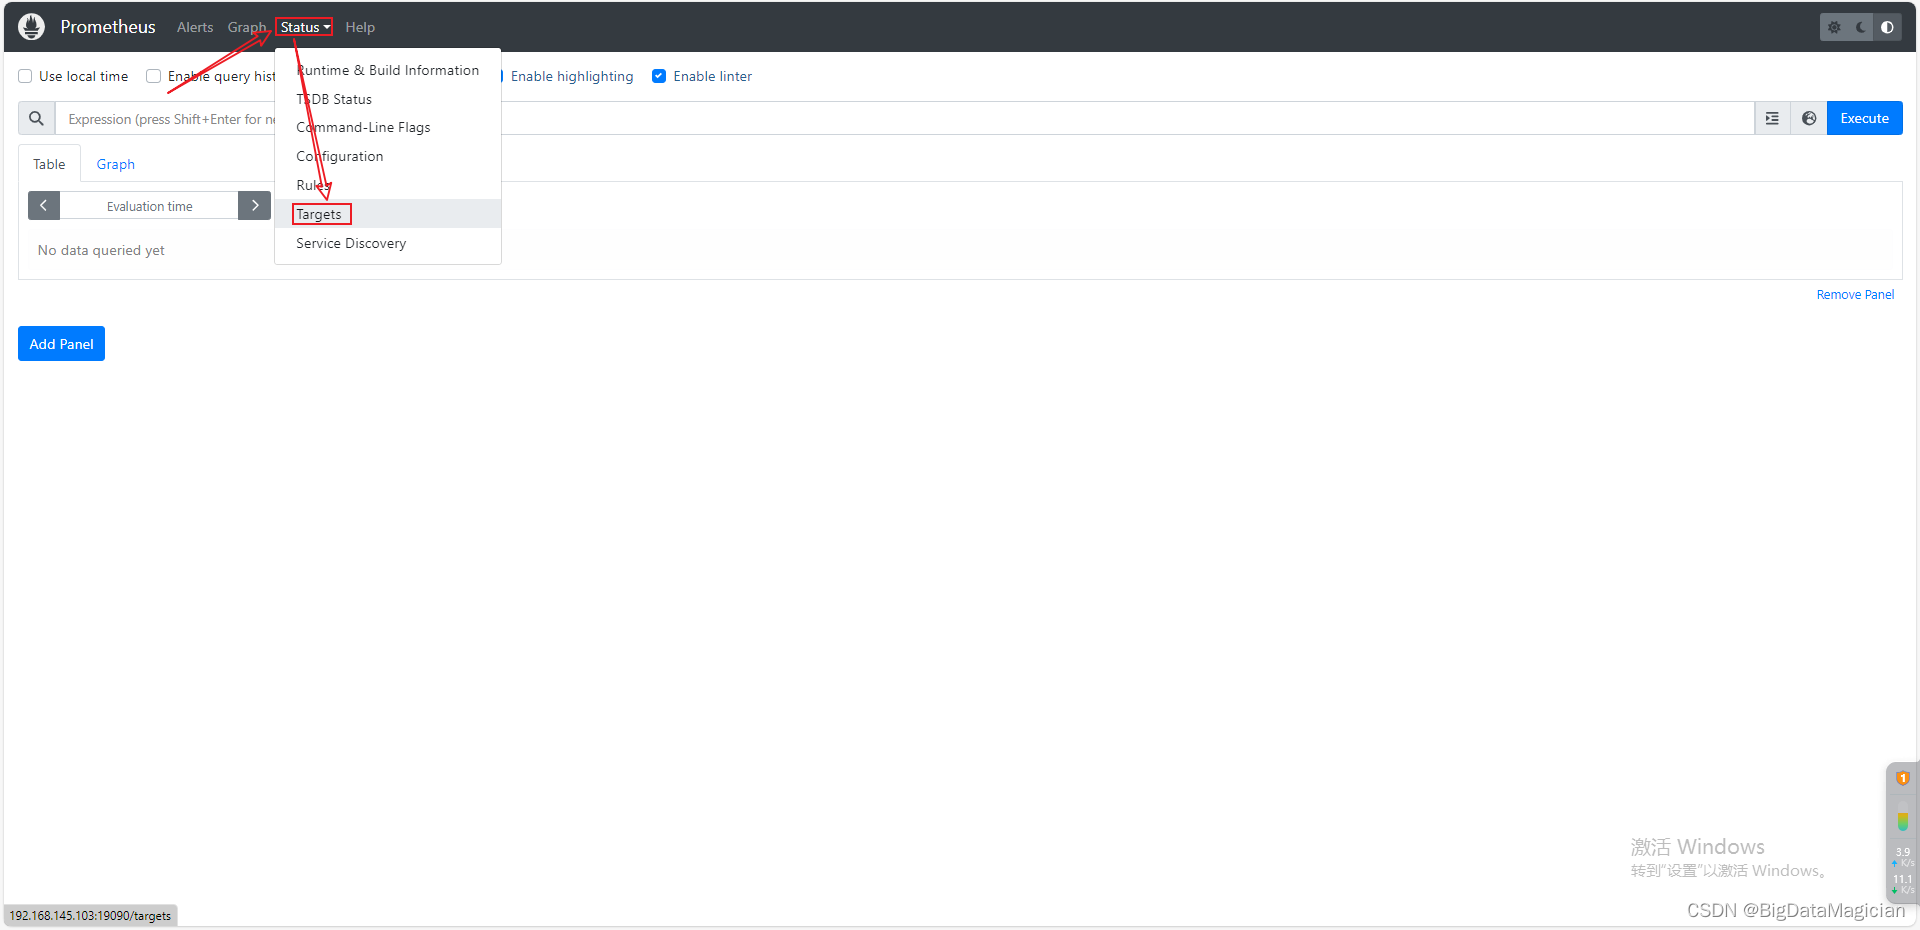
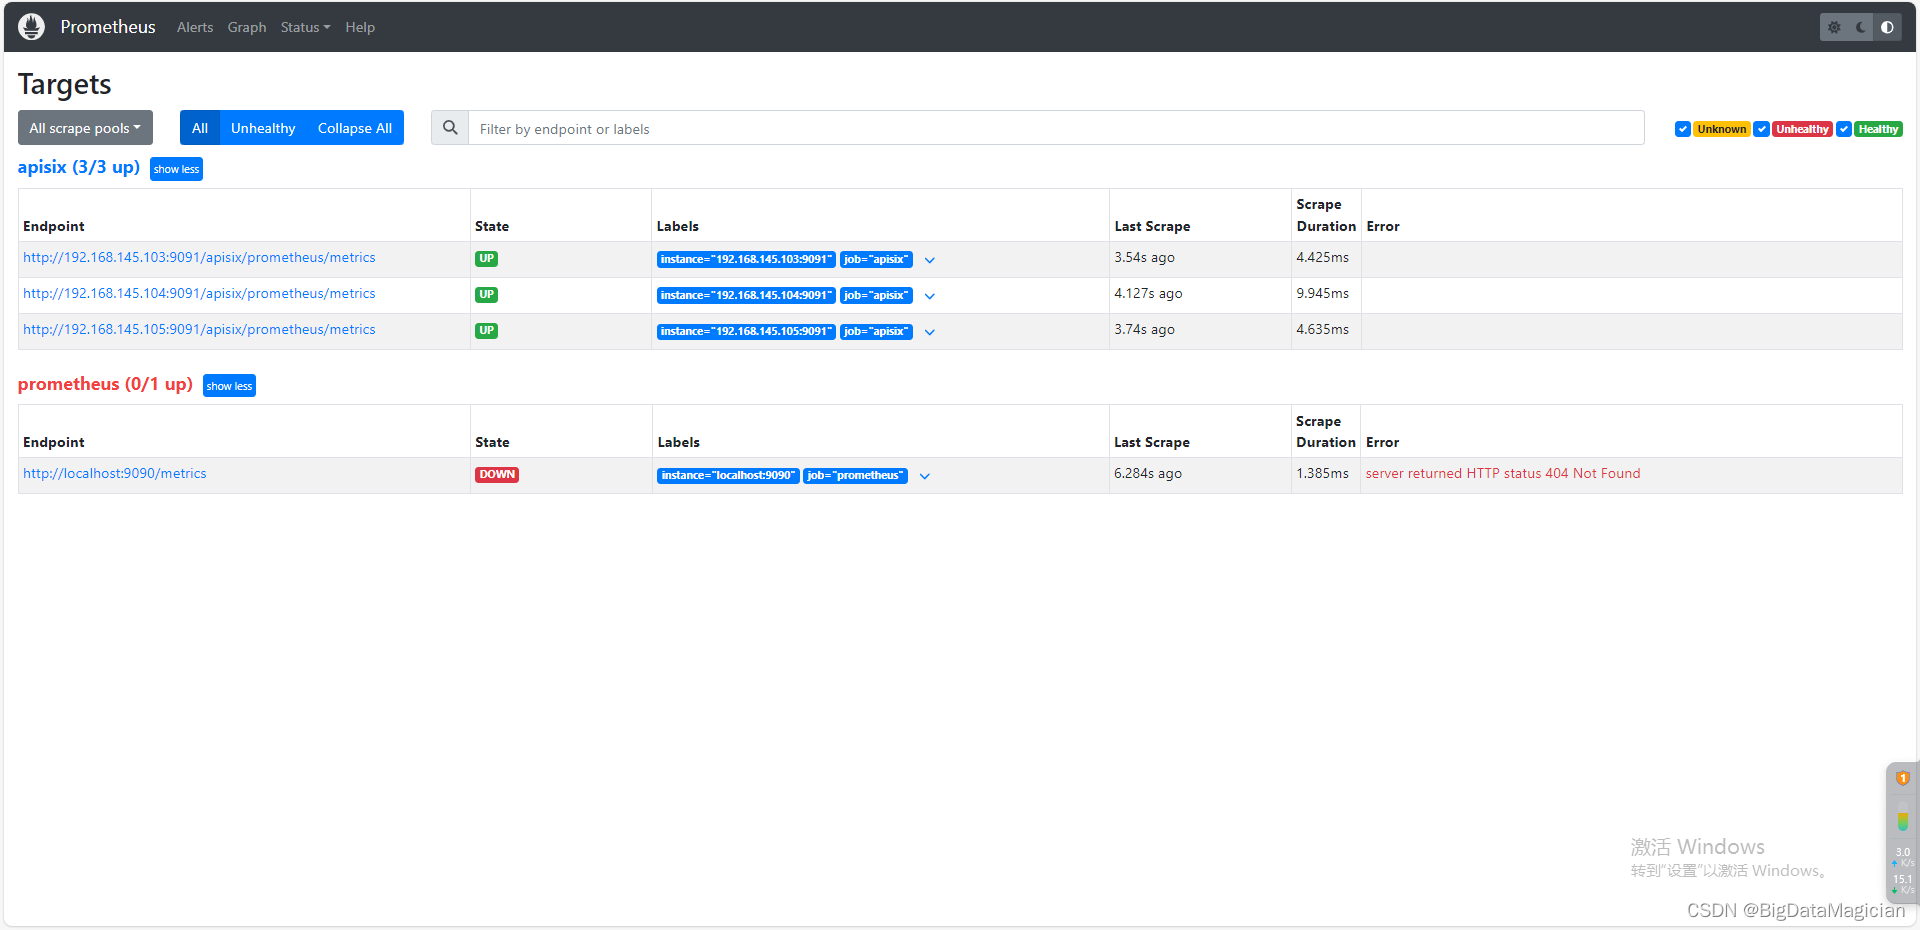
浏览器访问 http://localhost:9090 进入Prometheus页面,然后根据下图操作,可查看获取指标的相关信息。
3. Grafana配置
3.1 下载Apisix指标模版文件
点击下载Apisix指标模版文件。
3.2 配置Prometheus数据源
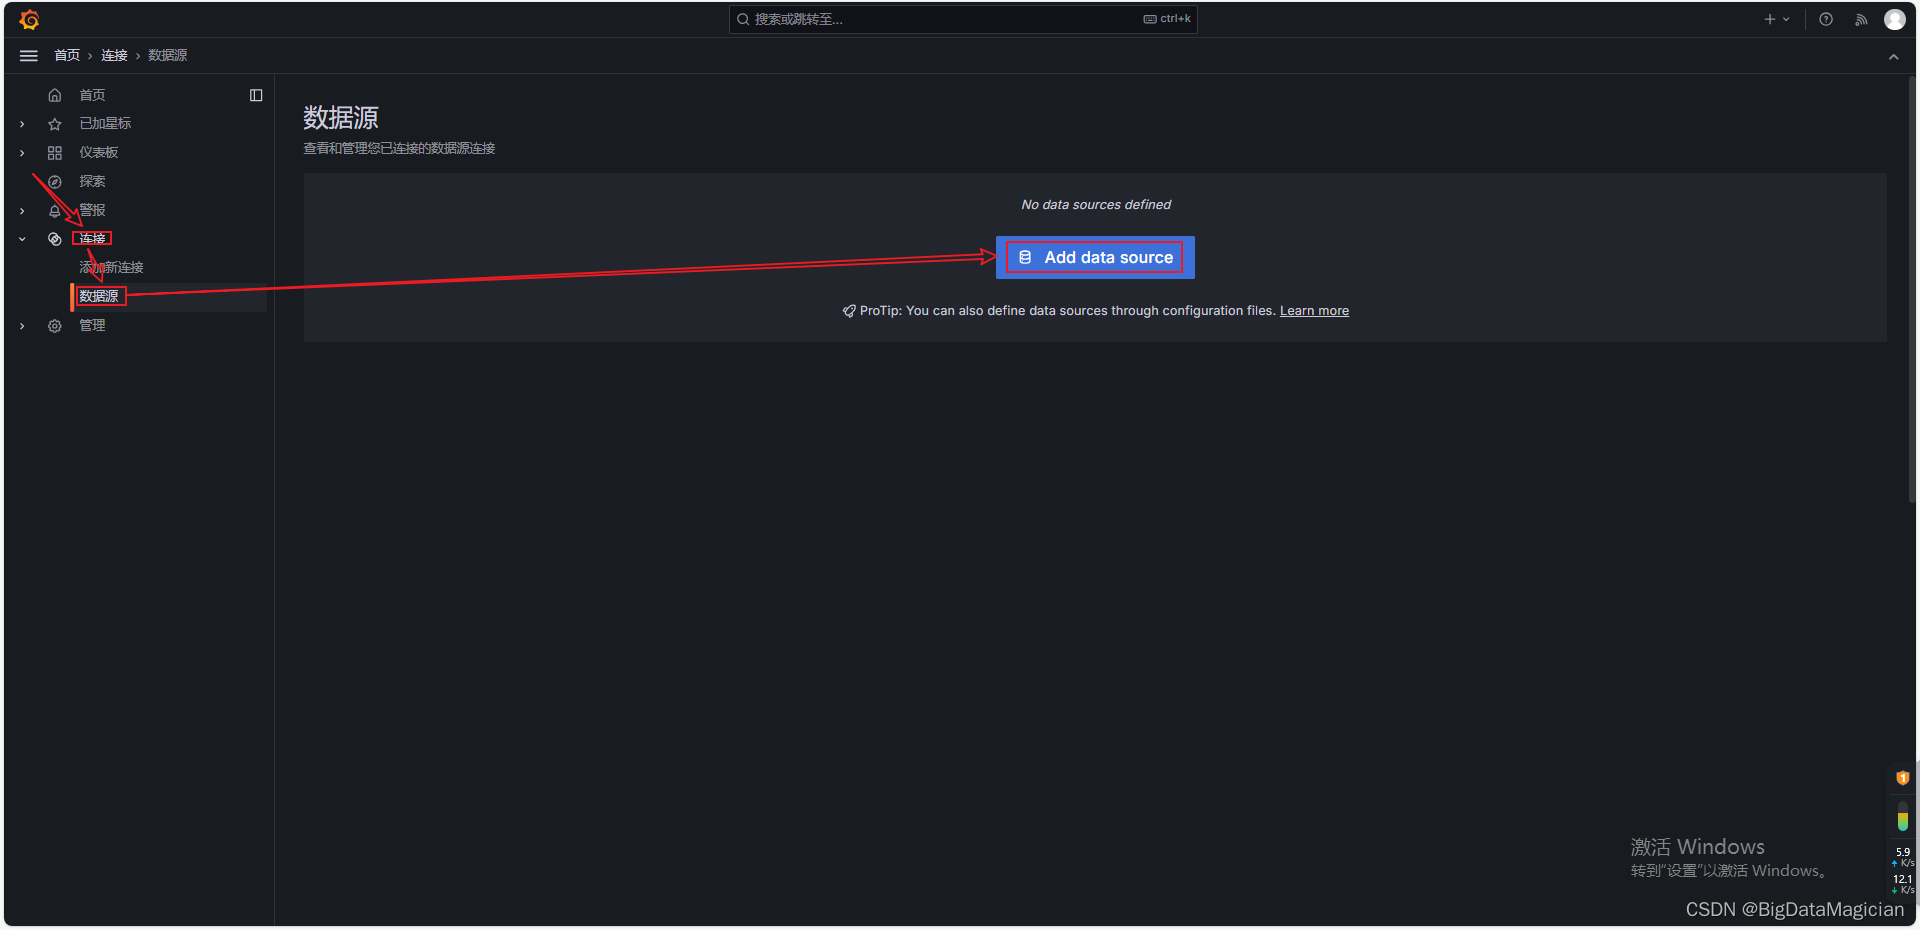
浏览器访问 http://localhost:3000 登录Grafana,然后根据下图操作创建数据源。
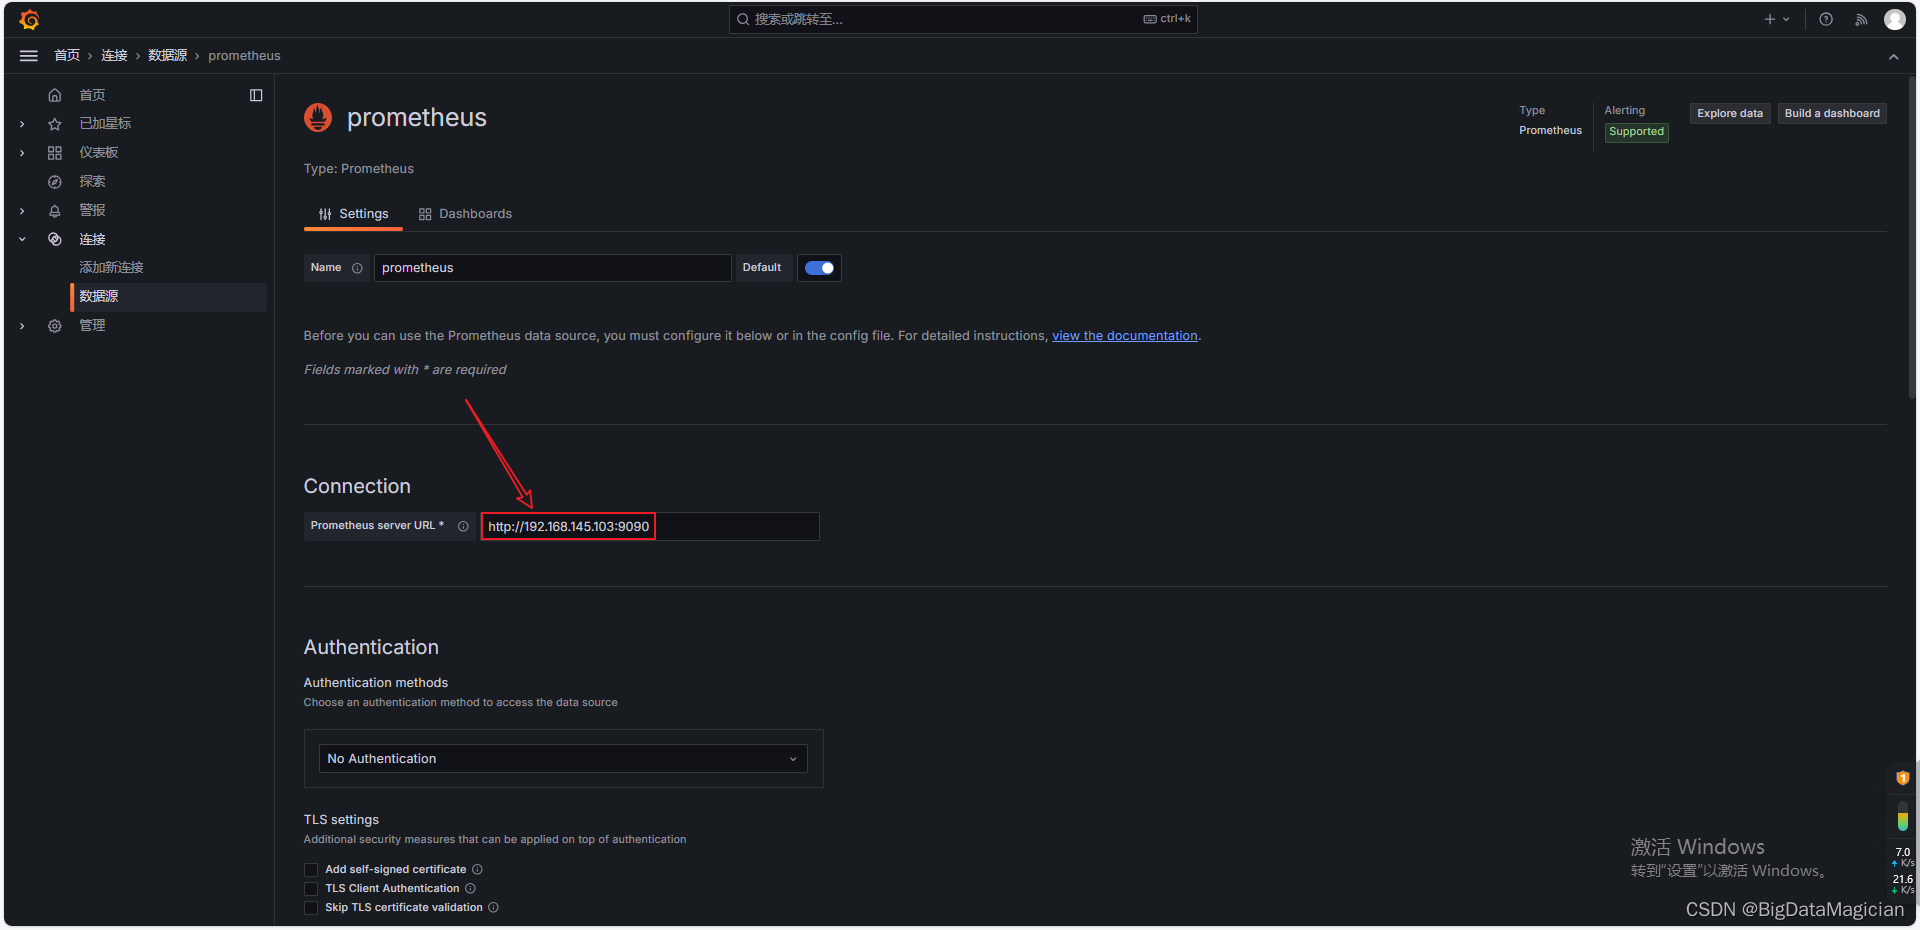
选择Prometheus数据源。

输入Prometheus地址。
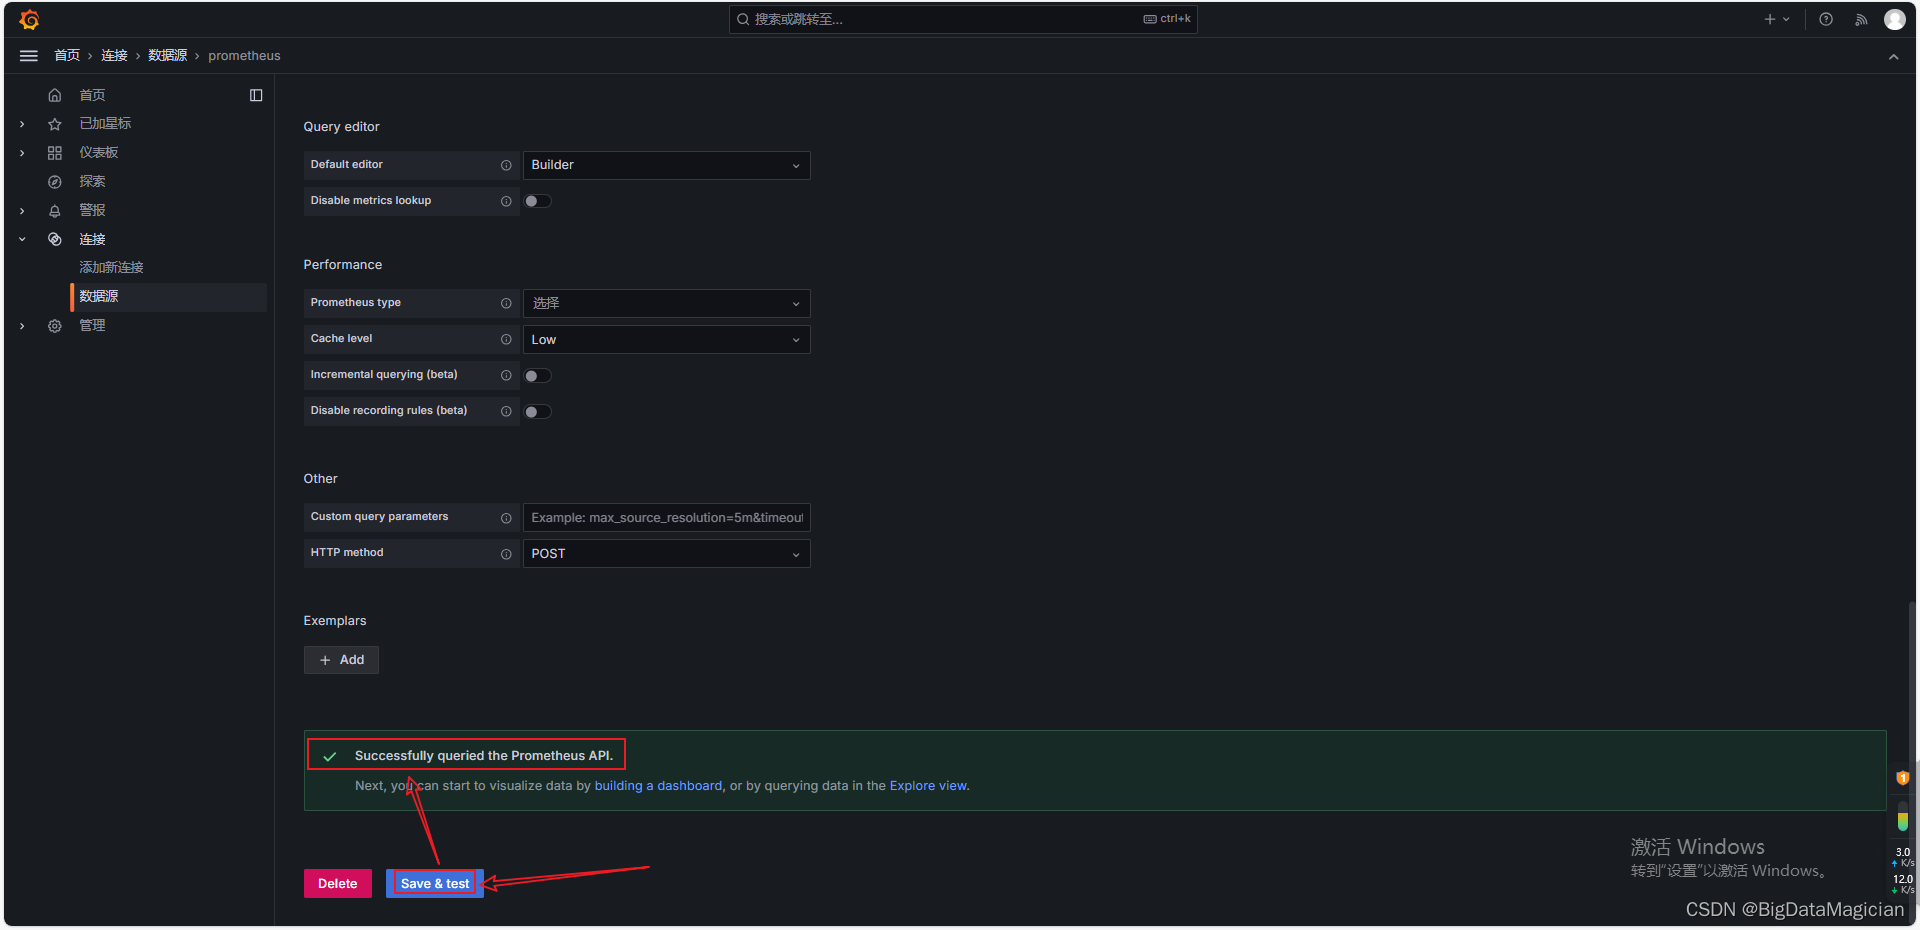
在最下面点击Save & test,出现Successfully queried the Prometheus API.即为成功。
新建仪表盘。
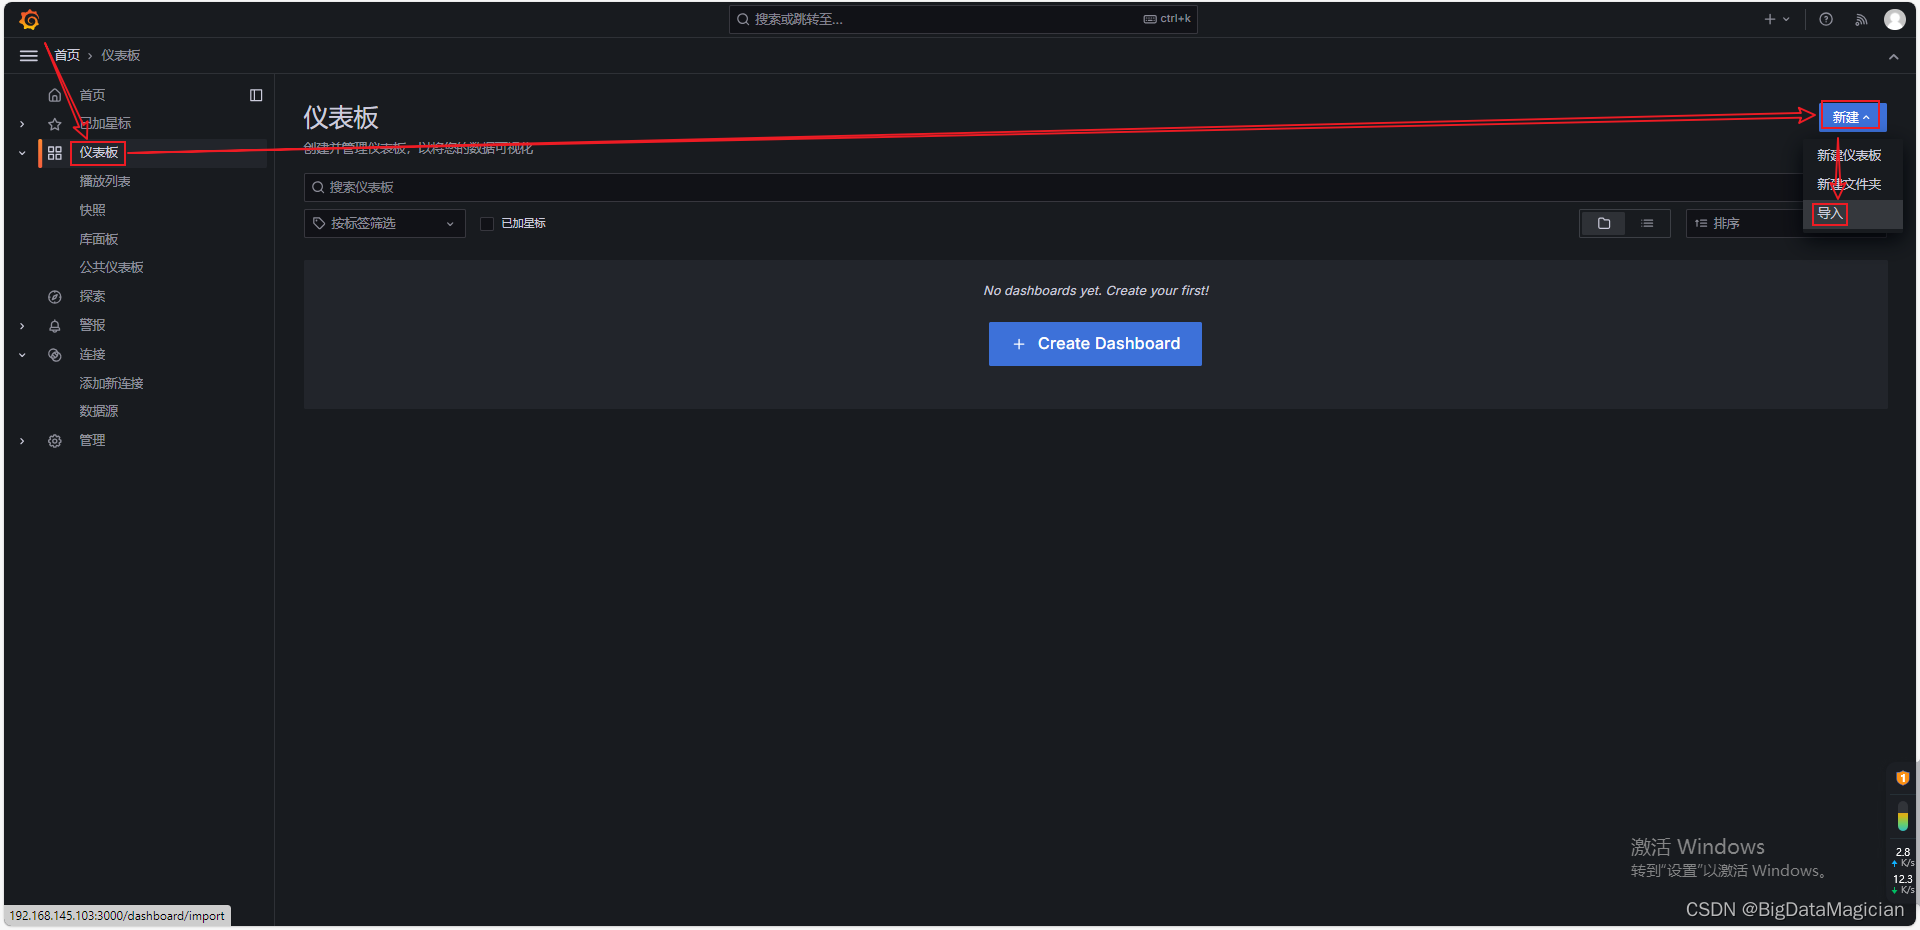
导入之前下载的Apisix指标模版文件。
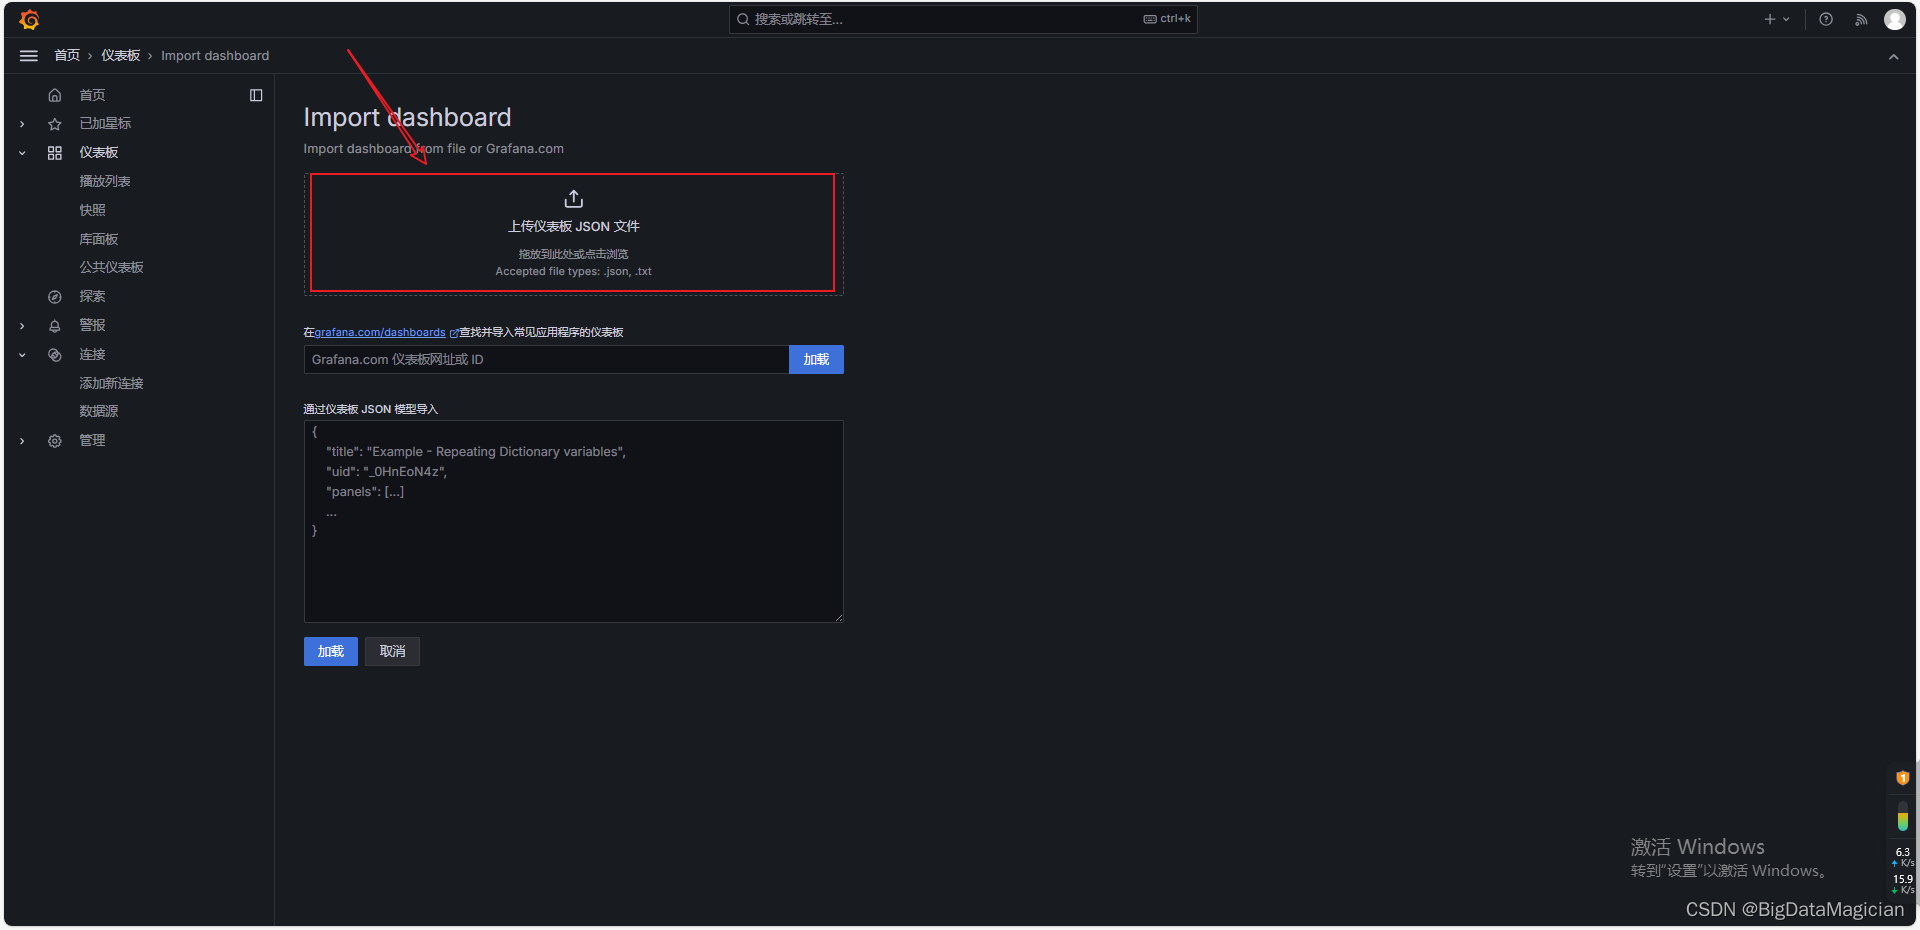
选择数据源后点击导入。
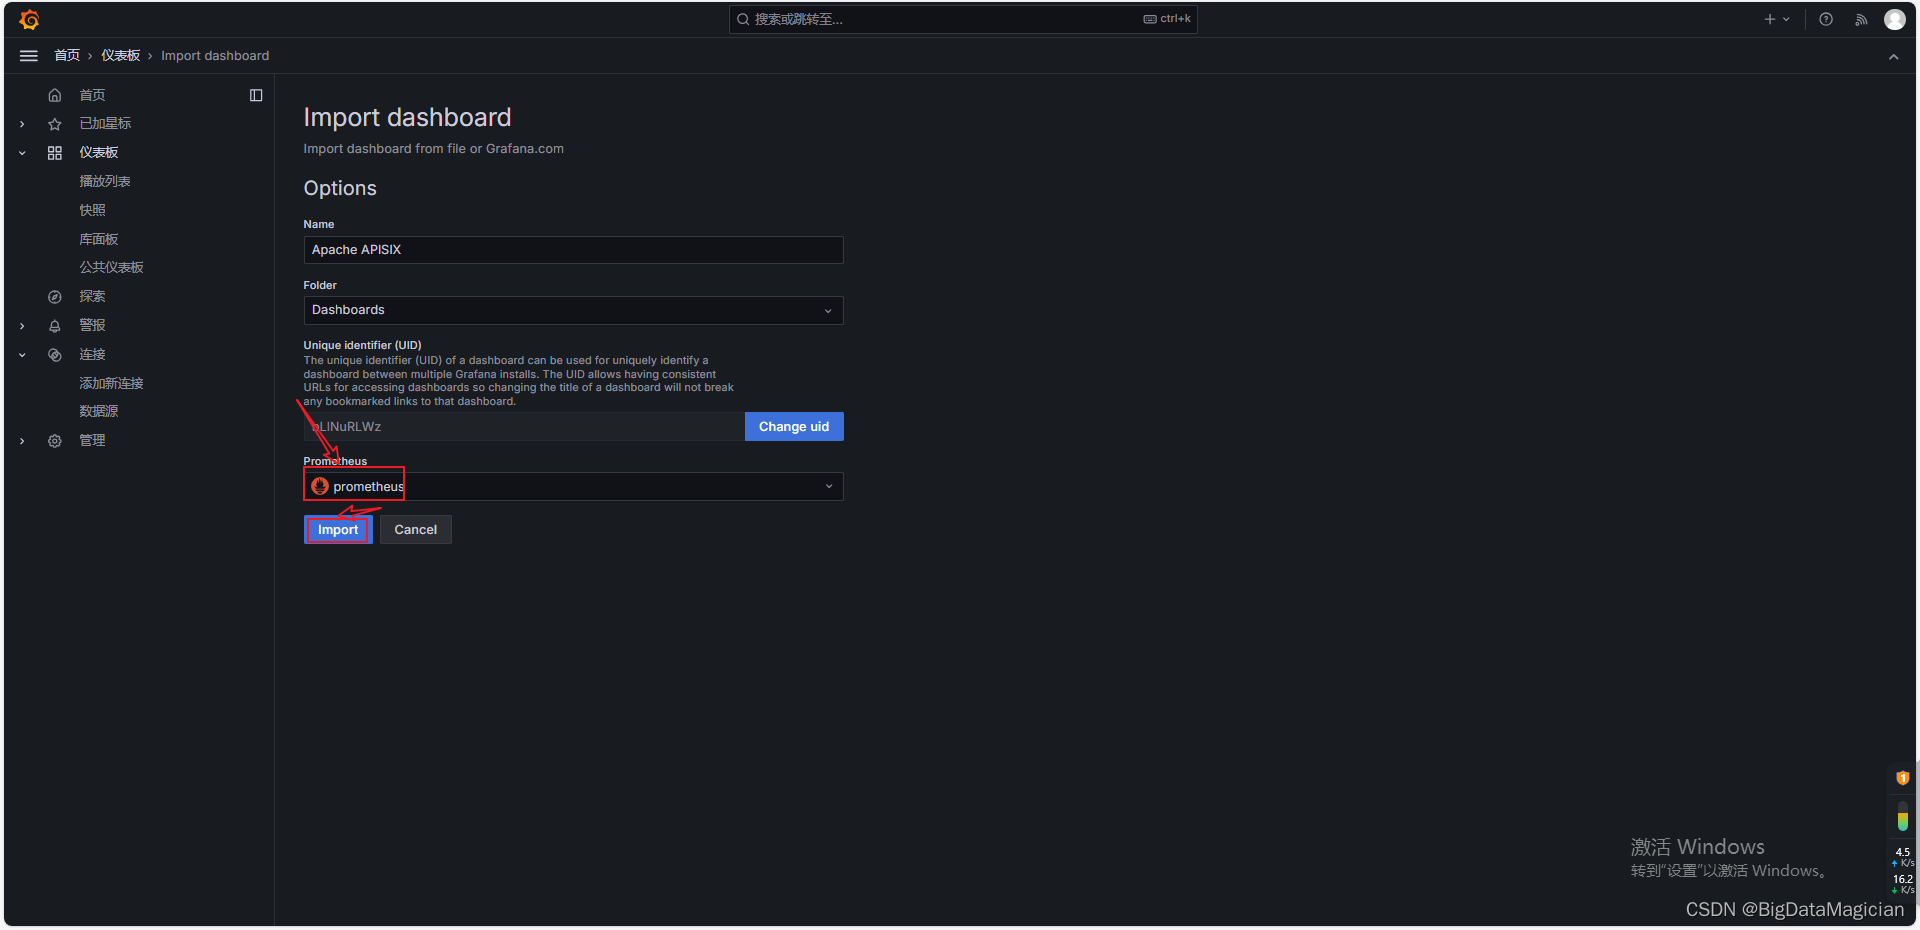
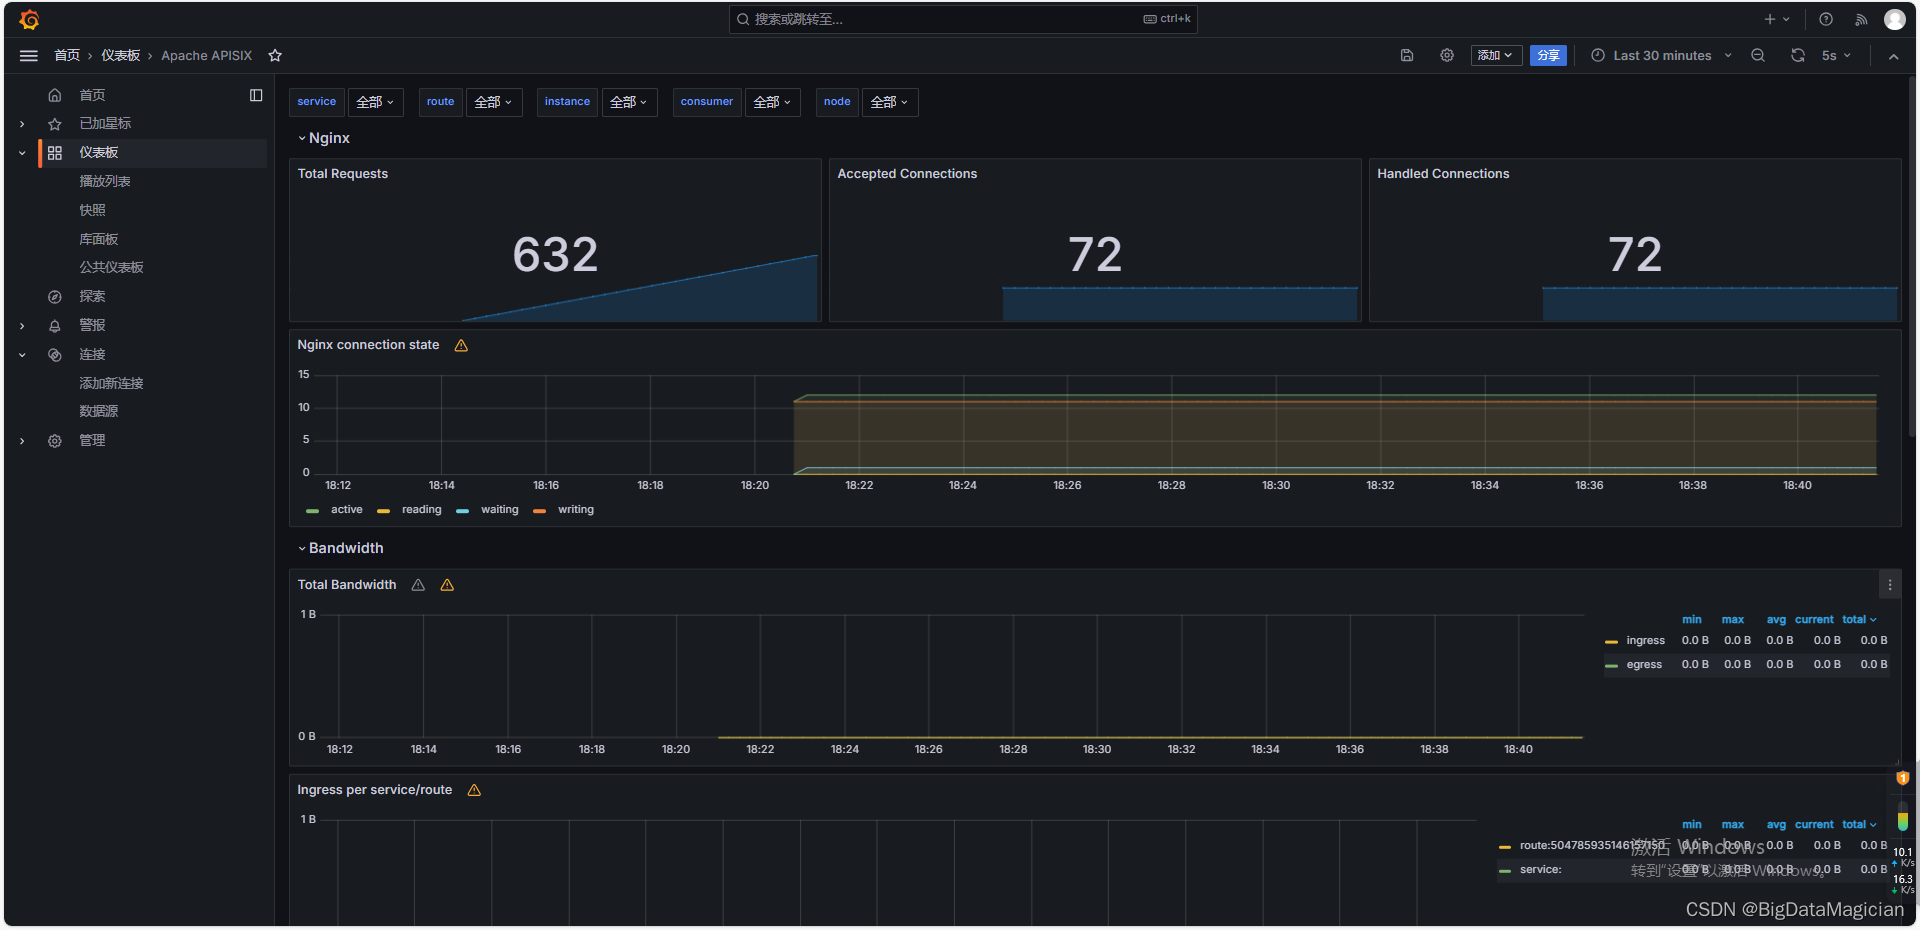
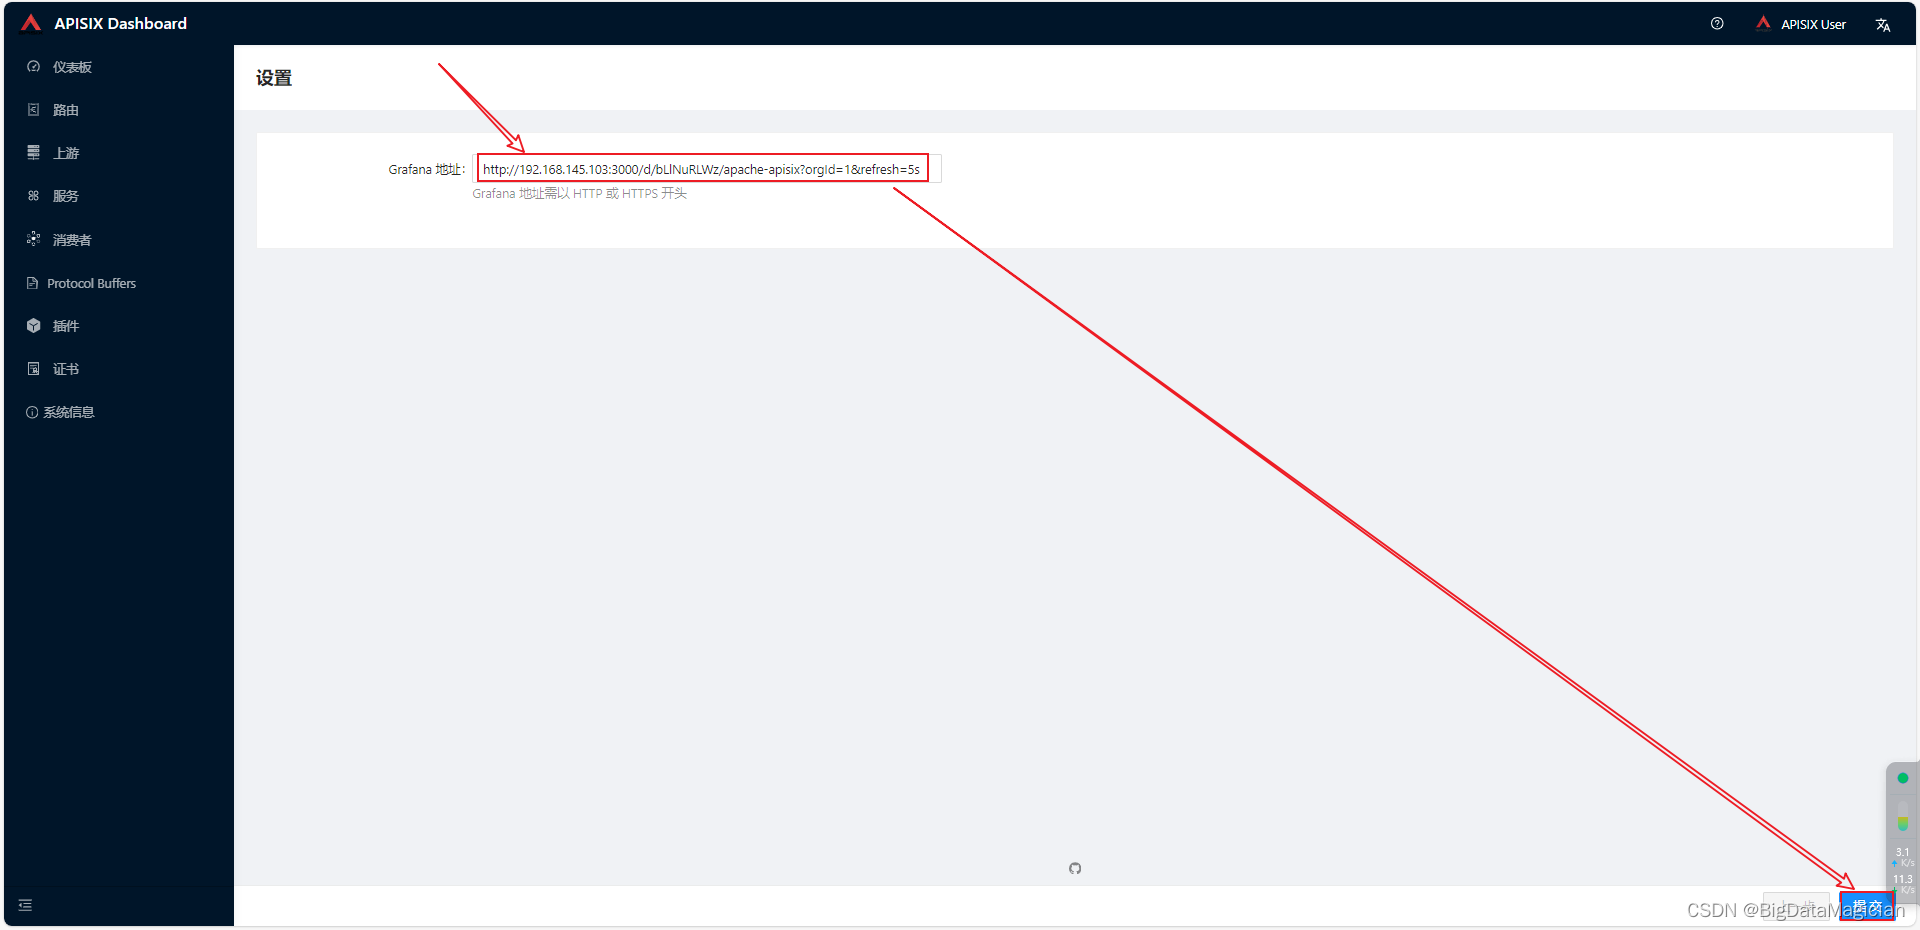
然后就会跳转到可视化界面。然后记住这个页面对应的url地址,后面需要使用该地址嵌入到Apisix。
五、嵌入Grafana到Apisix
1. 修改Grafana配置
修改 Grafana 配置文件,找到相关配置并修改为如下配置,允许 grafana 跨域。
vim /usr/share/grafana/conf/defaults.ini
1.1 启用匿名访问
[auth.anonymous]
enabled = true
1.2 允许通过 iframe 访问
allow_embedding = true
2. 修改apisix-dashboard配置
修改apisix-dashboard配置文件,添加如下配置。把192.168.145.103修改为安装Grafan的主机IP地址。
vim /usr/local/apisix/dashboard/conf/conf.yaml
conf:security:content_security_policy: "default-src 'self'; script-src 'self' 'unsafe-eval' 'unsafe-inline'; style-src 'self' 'unsafe-inline'; img-src 'self' data:; frame-src 192.168.145.103:3000"
3. 在Apisix中嵌入Grafana
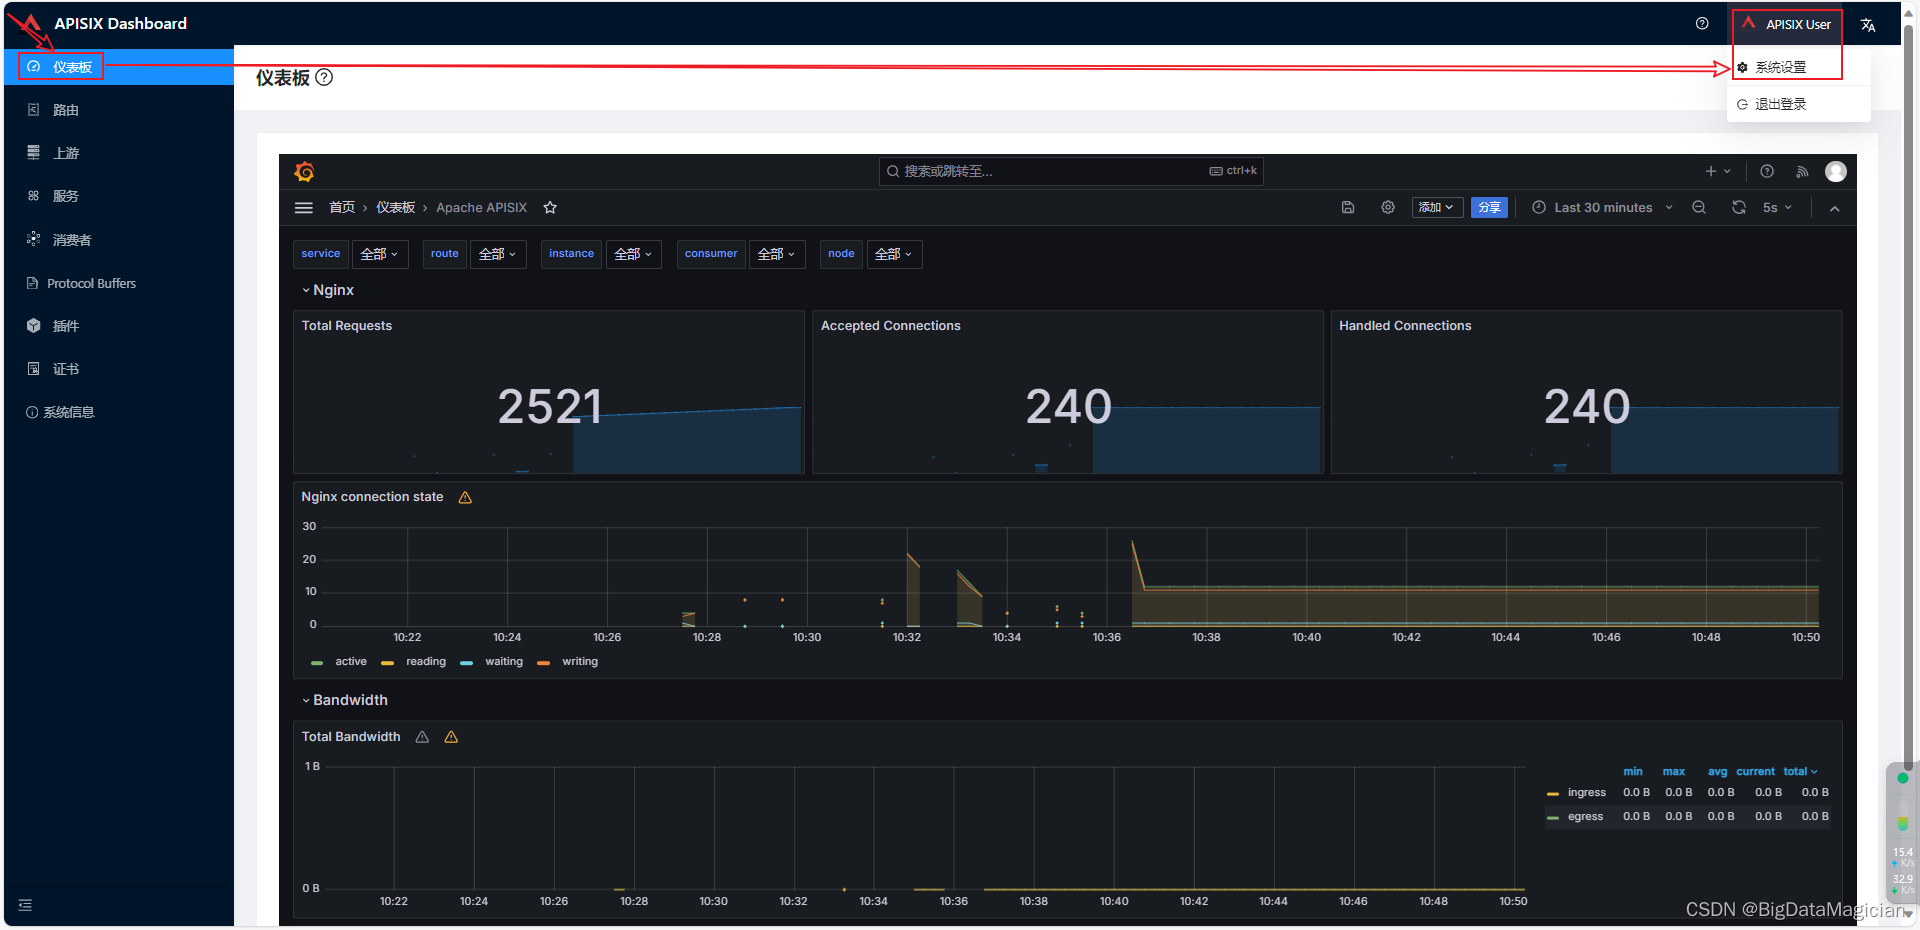
打开系统设置。
填入之前记住的地址,并点击提交。
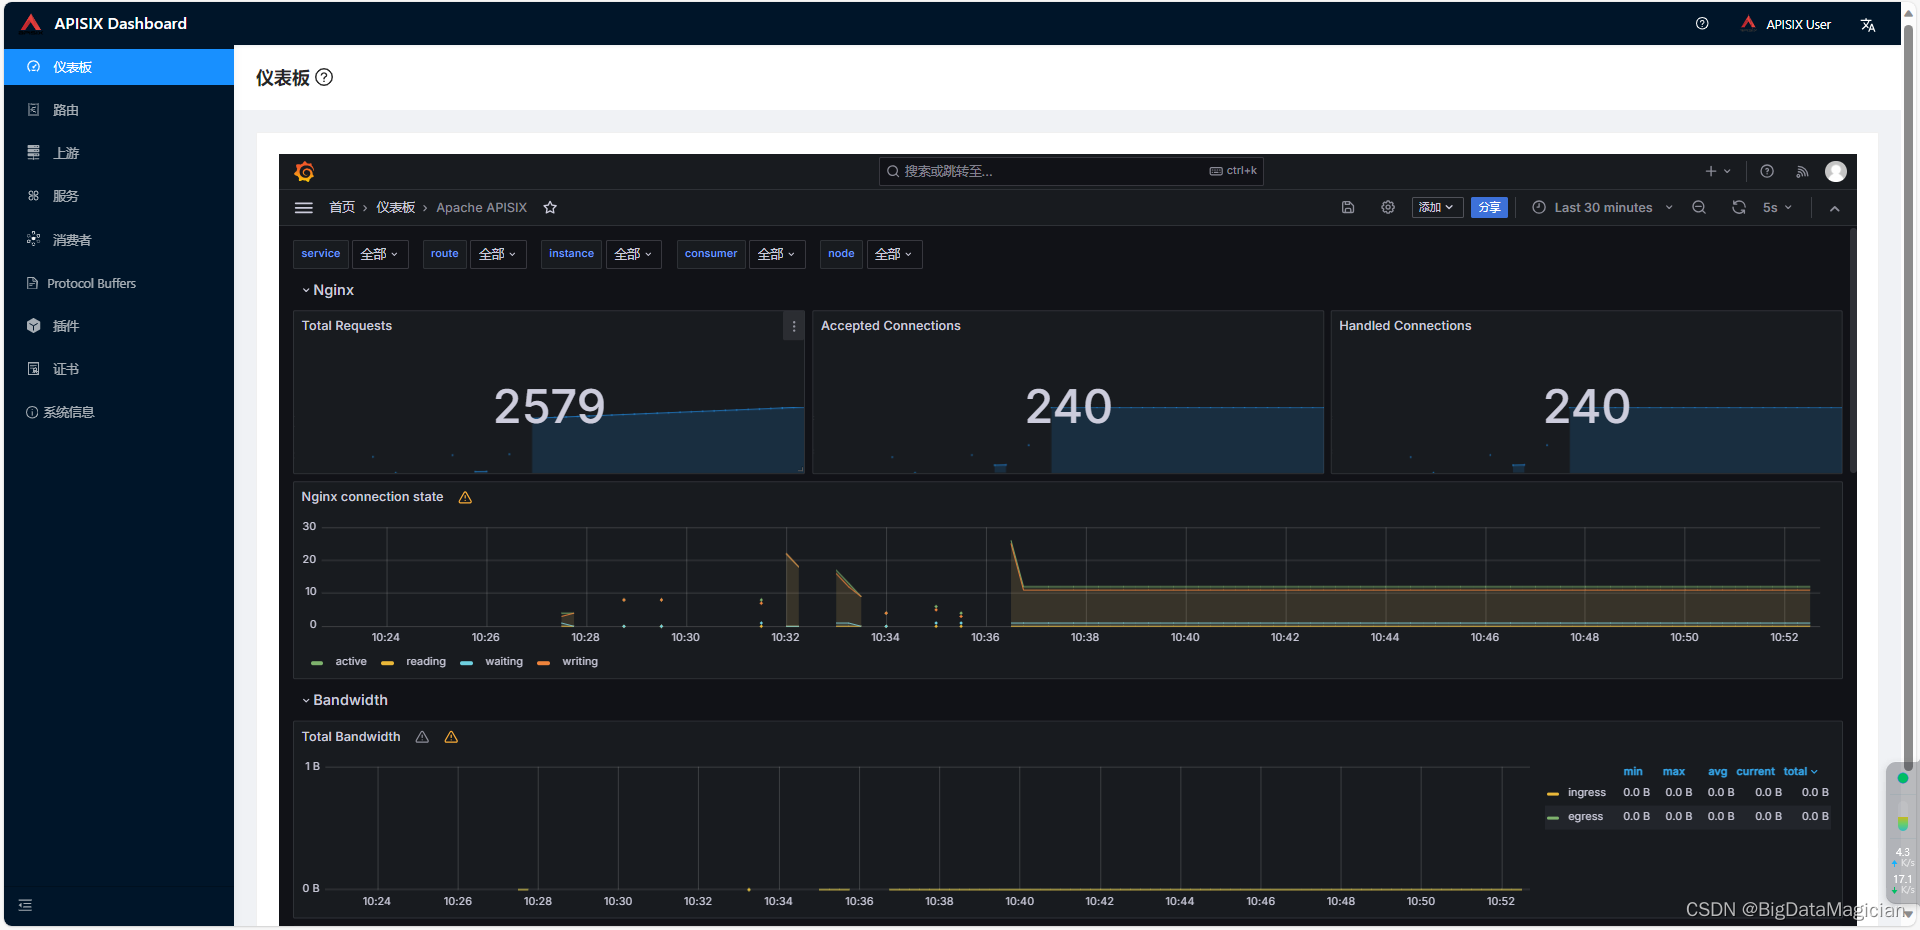
如下图,成功的把Grafana可视化页面嵌入到Apisix中。
总结
本文详细介绍了在Apisix中部署并配置Grafana与Prometheus来实现指标数据可视化的步骤。首先我们安装并设置好Grafana,然后配置Prometheus作为数据源,并在Grafana中导入和展示Apisix相关指标模板。最后,我们还讲解了如何将嵌入好的Grafana页面集成到Apisix中进行显示。通过这些步骤,您可以方便地监控和分析Apisisx服务运行时产生的各项性能指标。
希望本教程对您有所帮助!如有任何疑问或问题,请随时在评论区留言。感谢阅读!
