General
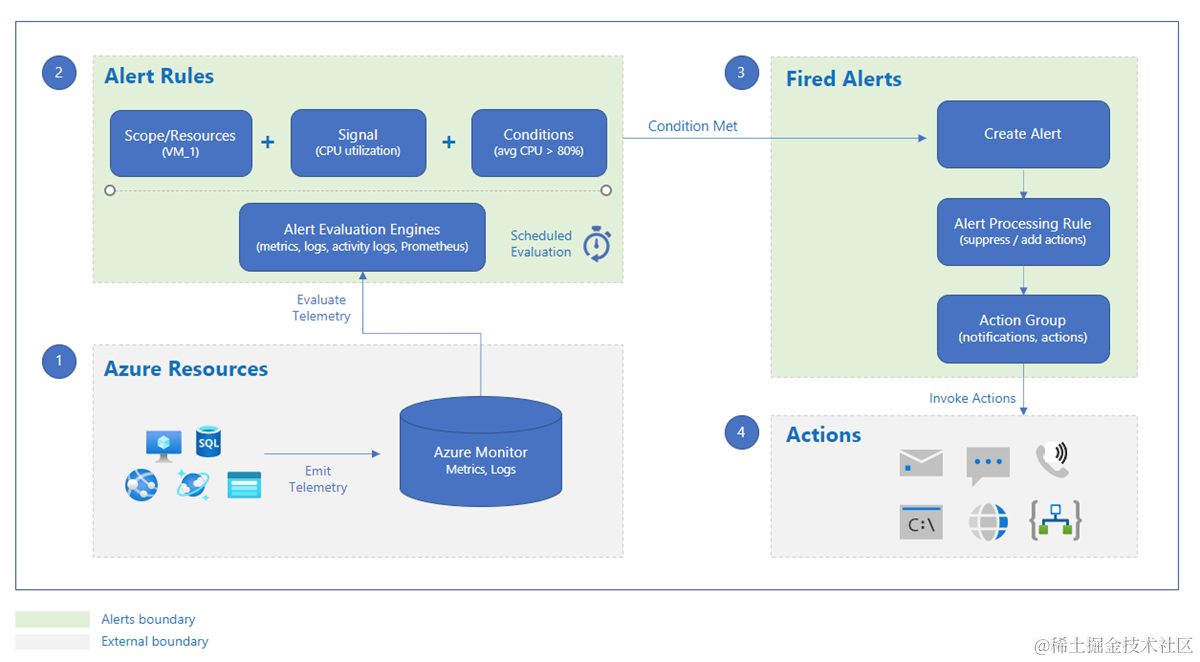
This document describes the recommended Azure monitors which can be implemented in Azure cloud application subscriptions.
SMT incident priority mapping
The priority “Blocker” is mostly used by Developers to prioritize their tasks and its not applicable for operations team.
| 0-CRITICAL | Critical | <= 4 hrs |
|---|---|---|
| 1-ERROR | High | <= 12hrs |
| 2-WARNING | Medium | <= 48hrs (2days) |
| 3 - Informational | Low | <= 96hrs (4days) |
| 4 - Verbose | No Ticket | Action based on the notification and analysis |
Recommended Azure Monitors
| All Resources | Resource Health | Resource Health | Previous resource status=All, Current resource status=All | Always | Current status | 4 - Verbose | MS teams | Included all future resource groups and future resourcesExcluding “Virtual machine instance from VMSS” |
|---|---|---|---|---|---|---|---|---|
| All Resources | Service Health | Service Health | Event types: Service issue, Planned maintenance , Health advisories, Security Advisories | Always | Current status | 4 - Verbose | MS teams | Regions : North Europe, West EuropeServices: Alerts & Metrics, Activity Logs & Alerts and 21 more |
| Azure SQL Database | CPU | Metric | app_cpu_percent > 80 | 5 mins | 1 hour | 2-WARNING | ||
| Azure SQL Database | CPU | Metric | app_cpu_percent > 95 | 5 mins | 1 hour | 1-ERROR | MS teams & Email | |
| Azure SQL Database | Memory | Metric | app_memory_percent > 80 | 5 mins | 1 hour | 2-WARNING | ||
| Azure SQL Database | Memory | Metric | app_memory_percent > 95 | 5 mins | 1 hour | 1-ERROR | MS teams & Email | |
| Azure SQL Database | Space | Metric | allocated_data_storage greater or less than dynamic threshold | 15 mins | 1 hour | 2-WARNING | ||
| AKS - Node | Node CPU | Metric | node_cpu_usage_percentage > 80 | 15 mins | 1 hour | 2-WARNING | Name of the node Include True | |
| AKS - Node | Node Memory | Metric | node_memory_working_set_percentage > 80 | 15 mins | 1 hour | 2-WARNING | Name of the node Include True | |
| AKS - Node | Node Disk | Metric | node_disk_usage_percentage > 80 | 15 mins | 1 hour | 2-WARNING | Name of the node Include True | |
| AKS - Node | Node Status (NotReady,Unknown) | Metric | kube_node_status_condition > 0 | 5 mins | 15 mins | 2-WARNING | ||
| AKS - Pods | Pods phases (Failed,Unknown,Pending) | Metric | kube_pod_status_phase >= 1 | 5 mins | 30 mins | 2-WARNING | Phase of the pod Include Failed,Unknown,Pending | |
| AKS - Pods | Unschedulable Pods | Metric | unschedulable > 1 | 15 mins | 1 hour | 2-WARNING | ||
| AKS - Pods | Pods ready state percentage | Metric | podReadyPercentage(preview) | 2-WARNING | ||||
| AKS - Containers | Restarting Containers | Metric | restarting container count(preview) | 2-WARNING | ||||
| AKS - Containers | OOM killed containers | Metric | oomKilledContainerCount)preview) | 2-WARNING | ||||
| AKS - Containers | CPU Exceeded Percentage | Metric | cpuExceededPercentage (preview) | 2-WARNING | ||||
| AKS - Containers | Memory working set exceeded percentage | Metric | memoryWorkingSetExceededPercentage(preview) | 2-WARNING | ||||
| Application Gateway | Unhealthy backend Host | Metric | UnhealthyHostCount > 0 | 1 min | 5 mins | 0-CRITICAL | MS teams & Email | |
| Application Gateway | Failed Requests | Metric | FailedRequests > 100 | 5 mins | 15 mins | 2-WARNING | ||
| Load balancer | SNAT Connection Status Count | Metric | SnatConnectionCount >= 1 | 5 mins | 15 mins | 2-WARNING | Connection State = Failed, Pending | |
| Public IP Addresses | Under DDoS attack or not | Metric | IfUnderDDoSAttack > 0 | 1 min | 5 mins | 0-CRITICAL | MS teams & Email | |
| Virtual machine scaleset | CPU Usage | Metric | Percentage CPU > 90 | 15 mins | 1 hour | 2-WARNING | ||
| Container Registry | Storage Used | Metric | StorageUsed > 90% of Storage size included in the SKU | 15 mins | 1 hour | 3 - Informational | Review this which SKU of ACR has this metric | |
| LogicApp | RunsFailed | Metric | RunsFailed>0 | 1 hour | 12 hours | 3 - Informational | ||
| Log Analytics Workspace | Container SIGKILL Error | Logs | Table rows Count > 0 | 15 mins | 15 mins | 2-WARNING | Signal KILL error Expand source | |
| Log Analytics Workspace | WAF_Possible_DDoS_Detected | Logs Query | count_ > 1000 | 15 mins | 15 mins | 1 - Error | MS teams & Email | WAF_Possible_DDoS_Detected Expand source |
| Log Analytics workspace | Node-restart-delayed triggered by Kured | Logs Query | 2-WARNING | Node-restart-delayed Expand source | ||||
| Log Analytics workspace | Node-restart-successful-Kured Action | Logs Query | OBSOLETE | Node-restart-successful Expand source | ||||
| Azure SQL Database / server | Vulnerability Scan Report | Vulnerability Scan Report | ||||||
| Failure | Failure Anomalies - ETAS-BCP-PT-Forensic-Logic-App Failure Anomalies detected 3 - Informational etas-bcp-pt-forensic-logic-app Application Insights Smart detector |
Requirements
| ACR | ACR - To trigger alert when Create or Update Images from the ACR | ? | |||||
|---|---|---|---|---|---|---|---|
| SQL DB | SQL DB - Slow / Long running Queries | ? | |||||
| Service Principal secret / certificate expiry | ? | ||||||
| AKS | Check if we can sent an alert if k8s is not able to scale in new workernode | ||||||
| VISUALIZATION KURED/AKS ALERTS | Currently we dont have a Dashboard / Vis for kured alertsA overview over time would be helpful to |
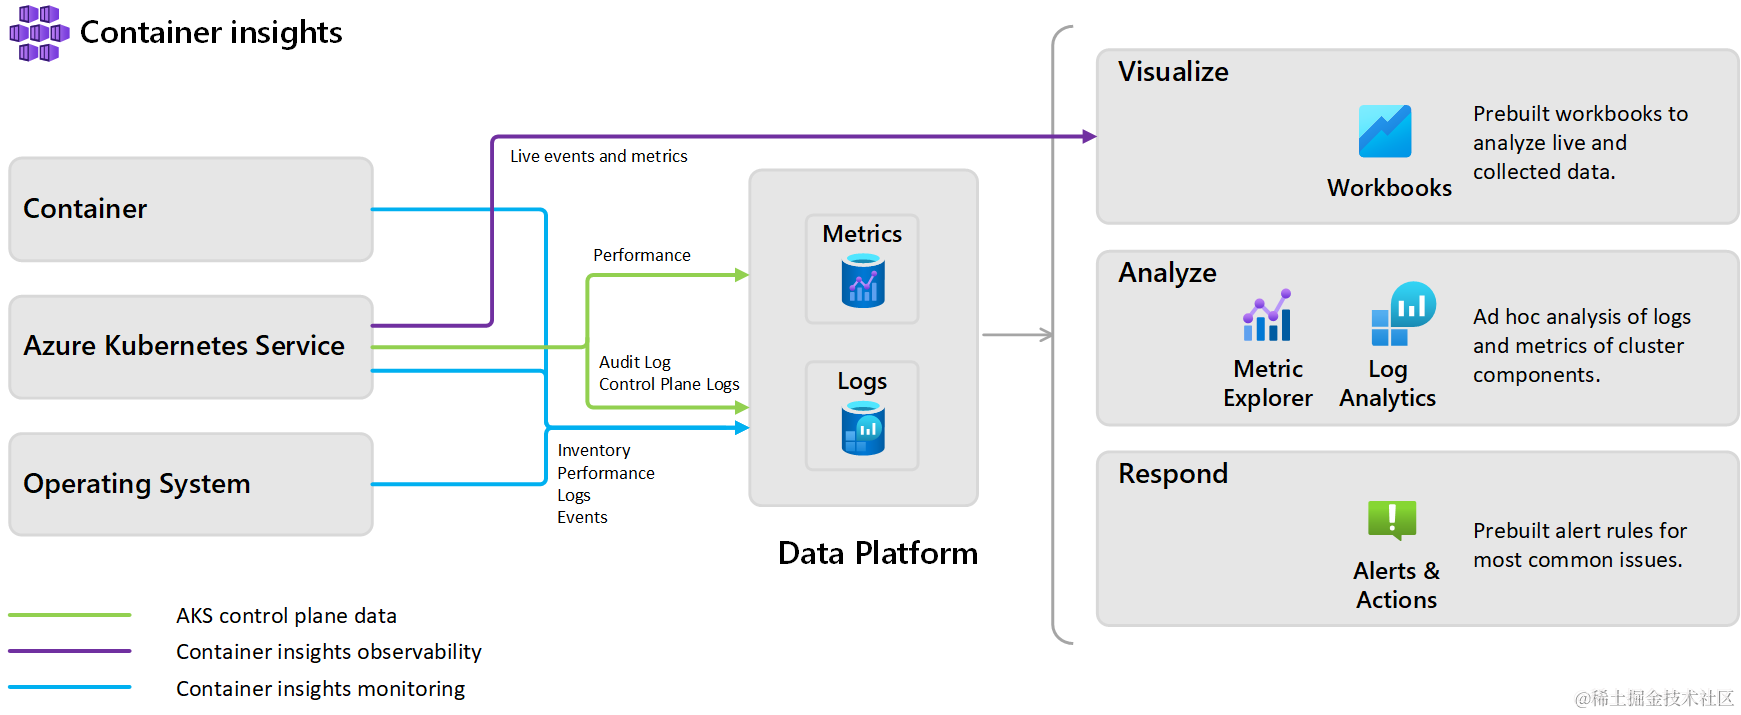
Refer : https://learn.microsoft.com/en-us/azure/azure-monitor/containers/container-insights-overview
https://learn.microsoft.com/en-us/azure/azure-monitor/alerts/alerts-overview
