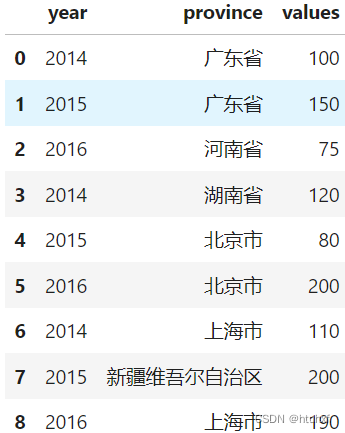
import pandas as pd# 假设DataFrame是这样的:
df = pd.DataFrame({  'year': [2014, 2015, 2016, 2014, 2015, 2016, 2014, 2015, 2016],  'province': ['广东省', '广东省', '河南省', '湖南省', '北京市', '北京市', '上海市', '新疆维吾尔自治区', '上海市'],  'values': [100, 150, 75,120, 80, 200, 110, 200, 190]
})
from pyecharts import options as opts
from pyecharts.charts import Map, Timeline
from pyecharts.globals import CurrentConfig, NotebookType# 设置jupyter lab可视的前提条件
CurrentConfig.NOTEBOOK_TYPE = NotebookType.JUPYTER_LAB# 按照年份对DataFrame进行分组,以便为每个年份创建地图
grouped_df = df.groupby('year')  t = Timeline()  # 遍历分组后的数据,为每个年份创建地图并添加到Timeline中
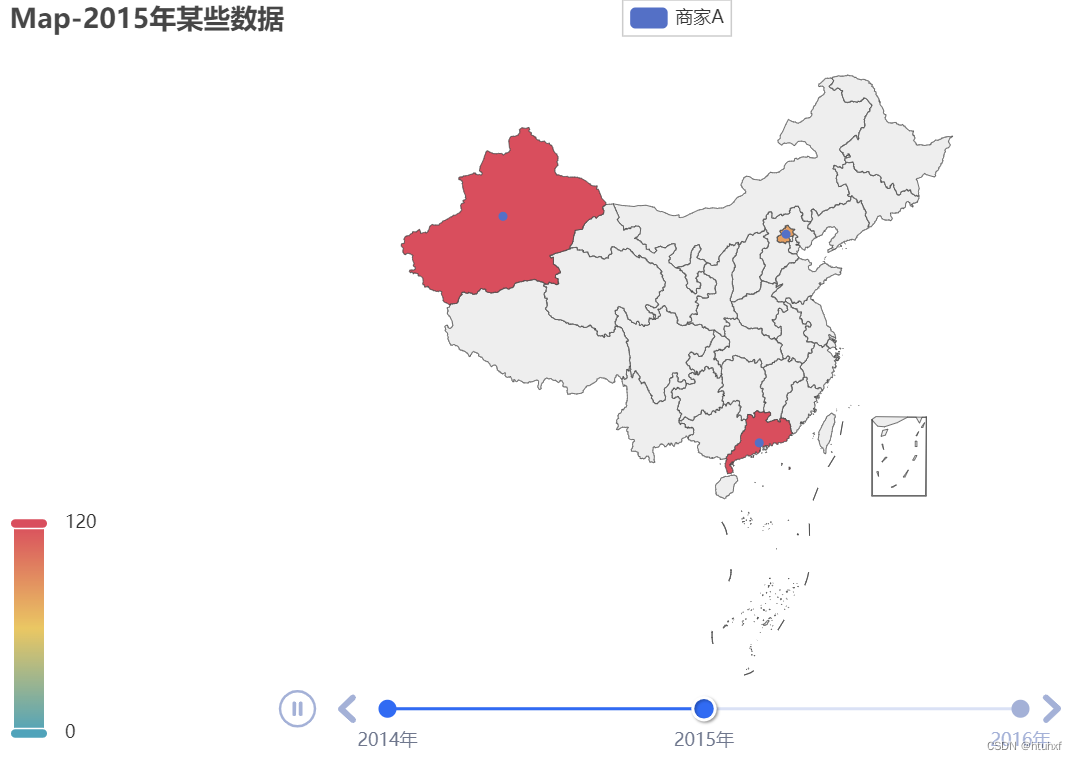
for year, year_df in grouped_df:  # 创建Map对象,并添加数据map_chart = (  Map()  .add(series_name="商家A", data_pair=year_df[['province', 'values']].to_numpy(), maptype="china")   .set_series_opts(label_opts=opts.LabelOpts(is_show=False))     # 是否显示省份名称.set_global_opts(title_opts=opts.TitleOpts(title=f"Map-{year}年某些数据"),  visualmap_opts=opts.VisualMapOpts(max_=df['values'].quantile())  # 默认值min_=0, max_=100。即是否用不同深浅的颜色填充MAP)  )  # 将地图添加到Timeline中,并设置时间点的名称  t.add(chart=map_chart, time_point="{}年".format(year))  # def timeline.add(self, chart: Base, time_point: str):t.render_notebook()
附注:
# github docu: pyecharts/options/series_options.py
class LabelOpts(BasicOpts):def __init__(self,is_show: bool = True,position: Optional[Union[str, Sequence]] = None,color: Optional[str] = None,distance: Union[Numeric, Sequence, None] = None,font_size: Optional[Numeric] = None,font_style: Optional[str] = None,font_weight: Optional[str] = None,font_family: Optional[str] = None,rotate: Optional[Numeric] = None,margin: Optional[Numeric] = 8,interval: Union[Numeric, str, None] = None,horizontal_align: Optional[str] = None,vertical_align: Optional[str] = None,formatter: Optional[JSFunc] = None,background_color: Optional[str] = None,border_color: Optional[str] = None,border_width: Optional[Numeric] = None,border_radius: Optional[Numeric] = None,padding: Union[Numeric, Sequence[Numeric], None] = None,text_width: Optional[Numeric] = None,text_height: Optional[Numeric] = None,overflow: Optional[str] = None,rich: Optional[dict] = None,):self.opts: dict = {"show": is_show,"position": position,"color": color,"distance": distance,"rotate": rotate,"margin": margin,"interval": interval,"fontSize": font_size,"fontStyle": font_style,"fontWeight": font_weight,"fontFamily": font_family,"align": horizontal_align,"verticalAlign": vertical_align,"formatter": formatter,"backgroundColor": background_color,"borderColor": border_color,"borderWidth": border_width,"borderRadius": border_radius,"padding": padding,"width": text_width,"height": text_height,"overflow": overflow,"rich": rich,}
# github docu: pyecharts/options/global_options.py
class TitleOpts(BasicOpts):def __init__(self,is_show: bool = True,title: Optional[str] = None,title_link: Optional[str] = None,title_target: Optional[str] = "blank",subtitle: Optional[str] = None,subtitle_link: Optional[str] = None,subtitle_target: Optional[str] = "blank",pos_left: Optional[str] = None,pos_right: Optional[str] = None,pos_top: Optional[str] = None,pos_bottom: Optional[str] = None,padding: Union[Sequence, Numeric] = 5,item_gap: Numeric = 10,text_align: str = "auto",text_vertical_align: str = "auto",is_trigger_event: bool = False,title_textstyle_opts: Union[TextStyleOpts, dict, None] = None,subtitle_textstyle_opts: Union[TextStyleOpts, dict, None] = None,):self.opts: Sequence = [{"show": is_show,"text": title,"link": title_link,"target": title_target,"subtext": subtitle,"sublink": subtitle_link,"subtarget": subtitle_target,"left": pos_left,"right": pos_right,"top": pos_top,"bottom": pos_bottom,"padding": padding,"itemGap": item_gap,"textAlign": text_align,"textVerticalAlign": text_vertical_align,"triggerEvent": is_trigger_event,"textStyle": title_textstyle_opts,"subtextStyle": subtitle_textstyle_opts,}]
# github docu: pyecharts/options/global_options.py
class VisualMapOpts(BasicOpts):def __init__(self,is_show: bool = True,type_: str = "color",min_: Numeric = 0,max_: Numeric = 100,range_: Sequence[Numeric] = None,range_text: Optional[Sequence] = None,range_color: Optional[Sequence[str]] = None,range_size: Optional[Sequence[int]] = None,range_opacity: Union[Numeric, Sequence[Numeric]] = None,orient: str = "vertical",pos_left: Optional[str] = None,pos_right: Optional[str] = None,pos_top: Optional[str] = None,pos_bottom: Optional[str] = None,padding: Union[int, Sequence[int]] = 5,split_number: int = 5,series_index: Union[Numeric, Sequence, None] = None,is_hover_link: bool = True,dimension: Optional[Numeric] = None,is_calculable: bool = True,is_piecewise: bool = False,is_inverse: bool = False,precision: Optional[int] = None,pieces: Optional[Sequence] = None,out_of_range: Optional[dict] = None,item_width: int = 0,item_height: int = 0,background_color: Optional[str] = None,border_color: Optional[str] = None,border_width: int = 0,textstyle_opts: Union[TextStyleOpts, dict, None] = None,):_inrange_op: dict = {}if type_ == "color":range_color = range_color or ["#50a3ba", "#eac763", "#d94e5d"]_inrange_op.update(color=range_color)elif type_ == "size":range_size = range_size or [20, 50]_inrange_op.update(symbolSize=range_size)if range_opacity is not None:_inrange_op.update(opacity=range_opacity)_visual_typ = "piecewise" if is_piecewise else "continuous"if is_piecewise and item_width == 0 and item_height == 0:item_width, item_height = 20, 14elif item_width == 0 and item_height == 0:item_width, item_height = 20, 140self.opts: dict = {"show": is_show,"type": _visual_typ,"min": min_,"max": max_,"text": range_text,"textStyle": textstyle_opts,"range": range_,"inRange": _inrange_op,"calculable": is_calculable,"inverse": is_inverse,"precision": precision,"splitNumber": split_number,"dimension": dimension,"seriesIndex": series_index,"hoverLink": is_hover_link,"orient": orient,"left": pos_left,"top": pos_top,"bottom": pos_bottom,"right": pos_right,"padding": padding,"showLabel": True,"itemWidth": item_width,"itemHeight": item_height,"outOfRange": out_of_range,"backgroundColor": background_color,"borderColor": border_color,"borderWidth": border_width,}if is_piecewise:self.opts.update(pieces=pieces)
