效果如图,鼠标滑动到某一个柱子的时候,出现这一项数据的多个自定义数据,外加自己的模板样式渲染。
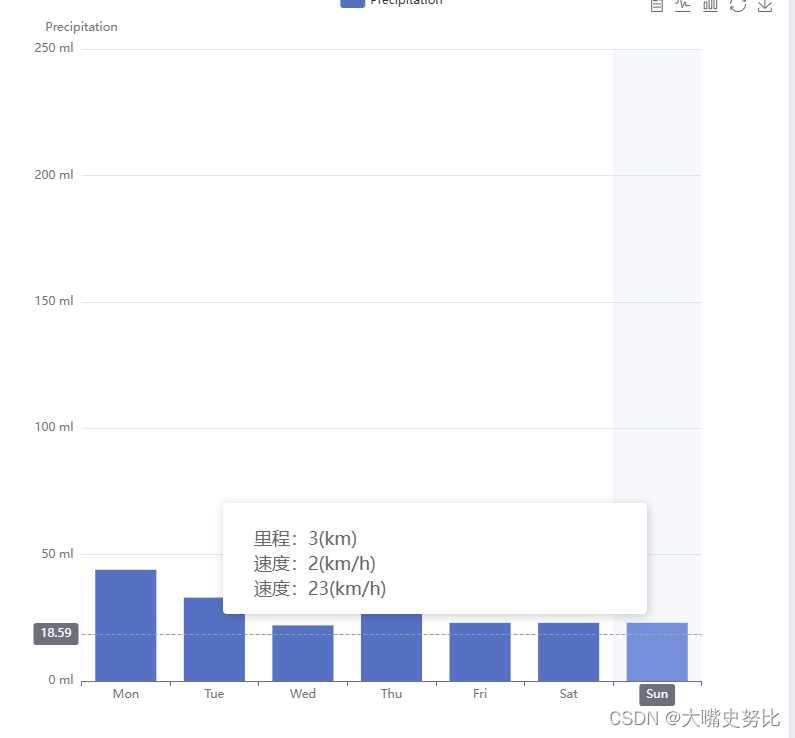
希望能展示每一列中的多个自定义数据
代码部分
主要是在data中,value就是实际展示的主数据,其他字段名为自定义的数据。
option = {tooltip: {trigger: 'axis',axisPointer: {type: 'cross',crossStyle: {color: '#999'}},formatter: function(params) {// params 是一个数组,包含了每个数据项的信息var result = `<div style="width: 402px;font-family: PingFang SC, PingFang SC-Regular;backdrop-filter: blur(20px);"><div class="top" style="margin-top:14px;margin-left:20px"><div class="tl" style="width: 50px;font-size: 18px;margin-bottom: 4px;margin-right: 200px;">里程:${params[0].data.b}(km)</div><div class="tr" style="width: 50px;font-size: 18px;margin-bottom: 4px;">速度:${params[0].data.a}(km/h)</div><div class="tr" style="width: 50px;font-size: 18px;margin-bottom: 4px;">速度:${params[0].data.value}(km/h)</div></div></div>`;return result;},},toolbox: {feature: {dataView: { show: true, readOnly: false },magicType: { show: true, type: ['line', 'bar'] },restore: { show: true },saveAsImage: { show: true }}},legend: {data: ['Precipitation', 'Temperature']},xAxis: [{type: 'category',data: ['Mon', 'Tue', 'Wed', 'Thu', 'Fri', 'Sat', 'Sun'],axisPointer: {type: 'shadow'}}],yAxis: [{type: 'value',name: 'Precipitation',min: 0,max: 250,interval: 50,axisLabel: {formatter: '{value} ml'}},],series: [{name: 'Precipitation',type: 'bar',tooltip: {valueFormatter: function (value) {return value + ' ml';}},data: [{value:44, a:2, b:3},{value:33, a:2, b:3},{value:22, a:2, b:3},{value:66, a:2, b:3},{value:23, a:2, b:3},{value:23, a:2, b:3},{value:23, a:2, b:3}],},]
};
