目录
精彩案例汇总
效果展示
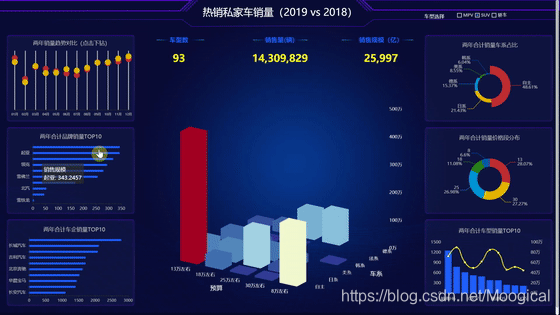
1、首先看动态效果图
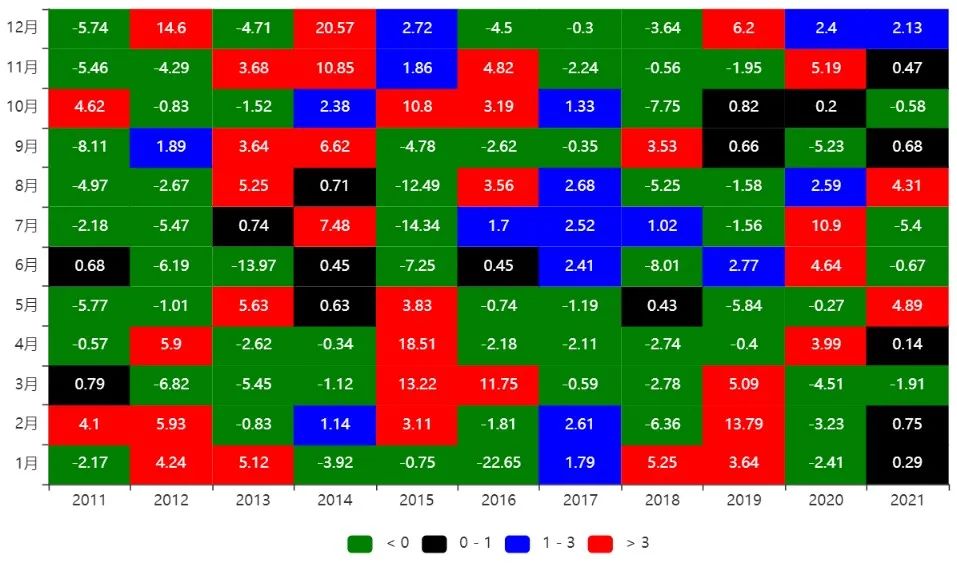
2、再看实时分片数据图
一、 确定需求方案
1、确定产品上线部署的屏幕LED分辨率
2、功能模块
3、部署方式
二、整体架构设计
三、编码实现 (基于篇幅及可读性考虑,此处展示部分关键代码)
1、前端html代码
2、前端js代码
3、后端python代码
四、上线运行
五、源码下载
精彩案例汇总
近年来,数据可视化大屏的出现,掀起一番又一番的浪潮,众多企业主纷纷想要打造属于自己的 “酷炫吊炸天” 的霸道总裁大屏驾驶舱。今天为大家分享的是 【互联网企业数据分析】。
之前小伙伴们建议我出一些视频课程来学习Echarts,这样可以更快上手,所以我就追星赶月的录制了《Echarts - 0基础入门课程》Echarts-0基础入门--其他视频教程-编程语言-CSDN程序员研修院 ,希望小伙伴们多多支持。
精彩案例汇总
YYDatav的数据可视化《精彩案例汇总》_YYDataV的博客-CSDN博客
话不多说,开始分享干货,欢迎讨论!微信号: 6550523
效果展示
1、首先看动态效果图

2、再看实时分片数据图

一、 确定需求方案
1、确定产品上线部署的屏幕LED分辨率
1920px*1080px,F11全屏后占满整屏且无滚动条。其它分辨率也可自适应。
2、功能模块
- 用户访问来源分析(饼图): 包括搜索引擎,联盟广告,直接访问
- 访问地区分布(柱状图 + 地图 + 热力图):浙江、上海、广东、北京
- 年龄分布(饼图):0岁以上、20-29岁、30-39岁、40-49岁、50岁以上
- 职业分布(饼图):电子商务、教育、IT/互联网、金融、学生、其他
- 兴趣分布(饼图):汽车、旅游、财经、教育、软件、其他
- 终端设备分布(线图):Android + iOS移动端设备使用量
- 频道访问量Top5(柱状图):实时显示最新Top5频道
- 点赞量Top5(饼图): 实时显示最新Top5地区
3、部署方式
基于免安装可执行程序:支持Windows、Linux、Mac等各种操作系统;将程序复制到服务器上即可,无需其它环境依赖;
观看方式:既可在服务器上直接观看程序界面,也可在远程用浏览器打开播放,例如Chrome浏览器、360浏览器等。
二、整体架构设计
- 前端基于Echarts开源库设计,使用WebStorm编辑器;
- 后端基于Python Web实现,使用Pycharm编辑器;
- 数据传输格式:JSON;
- 数据源类型:目前已支持PostgreSQL、MySQL、Oracle、Microsoft SQL Server、SQLite、Excel表格等,还可以定制HTTP API接口方式或其它类型数据库。
- 数据更新方式:摒弃了前端页面定时拉取的方式(这种方式带来严重的资源浪费),采用后端数据实时更新,实时推送到前端展示;
三、编码实现 (基于篇幅及可读性考虑,此处展示部分关键代码)
1、前端html代码
<!doctype html><html>
<head><meta charset="utf-8"><meta content="*" http-equiv="Access-Control-Allow-Origin"/><title>index</title><script src="js/jquery.js" type="text/javascript"></script><link href="css/comon0.css" rel="stylesheet">
</head>
<script>$(window).load(function () {$(".loading").fadeOut()})/****/$(document).ready(function () {var whei = $(window).width()$("html").css({fontSize: whei / 20})$(window).resize(function () {var whei = $(window).width()$("html").css({fontSize: whei / 20})});});
</script>
<script src="js/echarts.min.js" type="text/javascript"></script>
<script language="JavaScript" src="js/js.js"></script>
<body>
<div class="canvas" style="opacity: .2"><iframe frameborder="0" src="js/index.html" style="width: 100%; height: 100%"></iframe>
</div>
<div class="loading"><div class="loadbox"><img src="picture/loading.gif"> 页面加载中...</div>
</div>
<div class="head"><h1>大数据可视化展板 —— 互联网企业数据分析</h1><div class="weather"><!--<img src="picture/weather.png"><span>多云转小雨</span>--><span id="showTime"></span></div><script>//alert("aaaaaa");var t = null;t = setTimeout(time, 1000);//开始运行function time() {clearTimeout(t);//清除定时器dt = new Date();var y = dt.getFullYear();var mt = dt.getMonth() + 1;var day = dt.getDate();var h = dt.getHours();//获取时var m = dt.getMinutes();//获取分var s = dt.getSeconds();//获取秒document.getElementById("showTime").innerHTML = y + "年" + mt + "月" + day + "-" + h + "时" + m + "分" + s + "秒";//async_data();t = setTimeout(time, 1000); //设定定时器,循环运行}</script>
</div>
<div class="mainbox"><ul class="clearfix"><li><div class="boxall" style="height: 3.2rem"><div class="alltitle">用户访问来源</div><div class="allnav" id="echart1"></div><div class="boxfoot"></div></div><div class="boxall" style="height: 3.2rem"><div class="alltitle">访问地区分布</div><div class="allnav" id="echart2"></div><div class="boxfoot"></div></div><div class="boxall" style="height: 3.2rem"><div style="height:100%; width: 100%;"><div class="sy" id="fb1"></div><div class="sy" id="fb2"></div><div class="sy" id="fb3"></div></div><div class="boxfoot"></div></div></li><li><div class="bar"><div class="barbox"><ul class="clearfix"><li class="pulll_left counter " id="total_pv">12581189</li><li class="pulll_left counter" id="total_income">3912410</li></ul></div><div class="barbox2"><ul class="clearfix"><li class="pulll_left">总阅读量(pv)</li><li class="pulll_left">总收益</li></ul></div></div><div class="map"><div class="map1"><img src="picture/lbx.png"></div><div class="map2"><img src="picture/jt.png"></div><div class="map3"><img src="picture/map.png"></div><div class="map4" id="map_1"></div></div></li><li><div class="boxall" style="height:3.4rem"><div class="alltitle">终端设备分布</div><div class="allnav" id="echart4"></div><div class="boxfoot"></div></div><div class="boxall" style="height: 3.2rem"><div class="alltitle">频道访问量Top5</div><div class="allnav" id="echart5"></div><div class="boxfoot"></div></div><div class="boxall" style="height: 3rem"><div class="alltitle">点赞量Top5</div><div class="allnav" id="echart6"></div><div class="boxfoot"></div></div></li></ul>
</div>
<div class="back"></div><script src="js/china.js" type="text/javascript"></script>
<script src="js/area_echarts.js" type="text/javascript"></script>
</body>
</html>
2、前端js代码
var echarts_series_data = [{value: 335, name: '直接访问'},{value: 310, name: '邮件营销'},{value: 234, name: '联盟广告'},];
$(function() {echarts_1();echarts_2();echarts_4();echarts_31();echarts_32();echarts_33();echarts_5();echarts_6();function echarts_1() {var myChart = echarts.init(document.getElementById('echart1'));option = {title: {// text: '某站点用户访问来源',// subtext: '纯属虚构',left: 'center'},tooltip: {trigger: 'item',formatter: '{a} <br/>{b} : {c} ({d}%)'},legend: {// orient: 'vertical',left: 'left',// data: echarts_data},series: [{name: '访问来源',type: 'pie',radius: '55%',center: ['50%', '60%'],data: echarts_series_data,emphasis: {itemStyle: {shadowBlur: 10,shadowOffsetX: 0,shadowColor: 'rgba(0, 0, 0, 0.5)'}}}]};// 使用刚指定的配置项和数据显示图表。myChart.setOption(option);window.addEventListener("resize", function () {myChart.resize();});}function echarts_2() {// 基于准备好的dom,初始化echarts实例var myChart = echarts.init(document.getElementById('echart2'));var echarts_data = ['浙江', '上海', '江苏', '广东', '北京', '深圳', '安徽'];var echarts_series_data = [1500, 1200, 600, 200, 300, 300, 900];option = {//  backgroundColor: '#00265f',tooltip: {trigger: 'axis',axisPointer: { type: 'shadow'}},grid: {left: '0%',top:'10px',right: '0%',bottom: '4%',containLabel: true},xAxis: [{type: 'category',data: echarts_data,axisLine: {show: true,lineStyle: {color: "rgba(255,255,255,.1)",width: 1,type: "solid"},},axisTick: {show: false,},axisLabel:  {interval: 0,// rotate:50,show: true,splitNumber: 15,textStyle: {color: "rgba(255,255,255,.6)",fontSize: '12',},},}],yAxis: [{type: 'value',axisLabel: {//formatter: '{value} %'show:true,textStyle: {color: "rgba(255,255,255,.6)",fontSize: '12',},},axisTick: {show: false,},axisLine: {show: true,lineStyle: {color: "rgba(255,255,255,.1	)",width: 1,type: "solid"},},splitLine: {lineStyle: {color: "rgba(255,255,255,.1)",}}}],series: [{type: 'bar',data: echarts_series_data,barWidth:'35%', //柱子宽度// barGap: 1, //柱子之间间距itemStyle: {normal: {color:'#27d08a',opacity: 1,barBorderRadius: 5,}}}]
};// 使用刚指定的配置项和数据显示图表。myChart.setOption(option);window.addEventListener("resize", function () {myChart.resize();});}function echarts_5() {// 基于准备好的dom,初始化echarts实例var myChart = echarts.init(document.getElementById('echart5'));option = {dataset: {source: [['数量', '项目'],[ 28, 'C\C++'],[ 48, 'Java'],[ 61, 'Php'],[ 92, 'Python'],[ 101, 'Go']]},// grid: {containLabel: true},grid: {left: '0%',top:'10px',right: '0%',bottom: '4%',containLabel: true},xAxis: [{type: 'value',// type: 'category',// data: echarts_data,axisLine: {show: true,lineStyle: {color: "rgba(255,255,255,.1)",width: 1,type: "solid"},},axisTick: {show: false,},axisLabel: {interval: 0,// rotate:50,show: true,splitNumber: 15,textStyle: {color: "rgba(255,255,255,.6)",fontSize: '12',},},}],yAxis: [{type: 'category',// type: 'value',axisLabel: {//formatter: '{value} %'show: true,textStyle: {color: "rgba(255,255,255,.6)",fontSize: '12',},},axisTick: {show: false,},axisLine: {show: true,lineStyle: {color: "rgba(255,255,255,.1	)",width: 1,type: "solid"},},splitLine: {lineStyle: {color: "rgba(255,255,255,.1)",}}}],series: [{type: 'bar',encode: {// Map the "amount" column to X axis.x: '数量',// Map the "product" column to Y axisy: '产品'}}]};// 使用刚指定的配置项和数据显示图表。myChart.setOption(option);window.addEventListener("resize", function () {myChart.resize();});}function echarts_4() {// 基于准备好的dom,初始化echarts实例var myChart = echarts.init(document.getElementById('echart4'));option = {tooltip: {trigger: 'axis',axisPointer: {lineStyle: {color: '#dddc6b'}}},legend: {top:'0%',data:['安卓','IOS'],textStyle: {color: 'rgba(255,255,255,.5)',fontSize: '12',}},grid: {left: '10',top: '30',right: '10',bottom: '10',containLabel: true},xAxis: [{type: 'category',boundaryGap: false,axisLabel: {textStyle: {color: "rgba(255,255,255,.6)",fontSize: 12,},},axisLine: {lineStyle: {color: 'rgba(255,255,255,.2)'}},data: ['01', '02', '03', '04', '05', '06', '07', '08', '09', '11', '12', '13', '14', '15', '16', '17', '18', '19', '20', '21', '22', '23', '24']}, {axisPointer: {show: false},axisLine: {show: false},position: 'bottom',offset: 20,}],yAxis: [{type: 'value',axisTick: {show: false},axisLine: {lineStyle: {color: 'rgba(255,255,255,.1)'}},axisLabel: {textStyle: {color: "rgba(255,255,255,.6)",fontSize: 12,},},splitLine: {lineStyle: {color: 'rgba(255,255,255,.1)'}}}],series: [{name: '安卓',type: 'line',smooth: true,symbol: 'circle',symbolSize: 5,showSymbol: false,lineStyle: {normal: {color: '#0184d5',width: 2}},areaStyle: {normal: {color: new echarts.graphic.LinearGradient(0, 0, 0, 1, [{offset: 0,color: 'rgba(1, 132, 213, 0.4)'}, {offset: 0.8,color: 'rgba(1, 132, 213, 0.1)'}], false),shadowColor: 'rgba(0, 0, 0, 0.1)',}},itemStyle: {normal: {color: '#0184d5',borderColor: 'rgba(221, 220, 107, .1)',borderWidth: 12}},data: [3, 4, 3, 4, 3, 4, 3, 6, 2, 4, 2, 4,3, 4, 3, 4, 3, 4, 3, 6, 2, 4, 2, 4]},
{name: 'IOS',type: 'line',smooth: true,symbol: 'circle',symbolSize: 5,showSymbol: false,lineStyle: {normal: {color: '#00d887',width: 2}},areaStyle: {normal: {color: new echarts.graphic.LinearGradient(0, 0, 0, 1, [{offset: 0,color: 'rgba(0, 216, 135, 0.4)'}, {offset: 0.8,color: 'rgba(0, 216, 135, 0.1)'}], false),shadowColor: 'rgba(0, 0, 0, 0.1)',}},itemStyle: {normal: {color: '#00d887',borderColor: 'rgba(221, 220, 107, .1)',borderWidth: 12}},data: [5, 3, 5, 6, 1, 5, 3, 5, 6, 4, 6, 4, 8, 3, 5, 6, 1, 5, 3, 7, 2, 5, 1, 4]},]};// 使用刚指定的配置项和数据显示图表。myChart.setOption(option);window.addEventListener("resize", function () {myChart.resize();});}function echarts_6() {// 基于准备好的dom,初始化echarts实例var myChart = echarts.init(document.getElementById('echart6'));var dataStyle = {normal: {label: {show: false},labelLine: {show: false},//shadowBlur: 40,//shadowColor: 'rgba(40, 40, 40, 1)',}
};
var placeHolderStyle = {normal: {color: 'rgba(255,255,255,.05)',label: {show: false,},labelLine: {show: false}},emphasis: {color: 'rgba(0,0,0,0)'}
};
option = {color: ['#0f63d6', '#0f78d6', '#0f8cd6', '#0fa0d6', '#0fb4d6'],tooltip: {show: true,formatter: "{a} : {c} "},legend: {itemWidth: 10,itemHeight: 10,itemGap: 12,bottom: '3%',data: ['浙江', '上海', '广东', '北京', '深圳'],textStyle: {color: 'rgba(255,255,255,.6)',}},series: [{name: '浙江',type: 'pie',clockWise: false,center: ['50%', '42%'],radius: ['59%', '70%'],itemStyle: dataStyle,hoverAnimation: false,data: [{value: 80,name: '01'}, {value: 20,name: 'invisible',tooltip: {show: false},itemStyle: placeHolderStyle}]},{name: '上海',type: 'pie',clockWise: false,center: ['50%', '42%'],radius: ['49%', '60%'],itemStyle: dataStyle,hoverAnimation: false,data: [{value: 70,name: '02'}, {value: 30,name: 'invisible',tooltip: {show: false},itemStyle: placeHolderStyle}]}, {name: '广东',type: 'pie',clockWise: false,hoverAnimation: false,center: ['50%', '42%'],radius: ['39%', '50%'],itemStyle: dataStyle,data: [{value: 65,//name: '03'}, {value: 35,//name: 'invisible',//tooltip: {show: false},itemStyle: placeHolderStyle}]} ]
};// 使用刚指定的配置项和数据显示图表。myChart.setOption(option);window.addEventListener("resize", function () {myChart.resize();});}function echarts_31() {// 基于准备好的dom,初始化echarts实例var myChart = echarts.init(document.getElementById('fb1'));
option = {title: [{text: '年龄分布',left: 'center',textStyle: {color: '#fff',fontSize:'16'}}],tooltip: {trigger: 'item',formatter: "{a} <br/>{b}: {c} ({d}%)",
position:function(p){   //其中p为当前鼠标的位置return [p[0] + 10, p[1] - 10];}},legend: {top:'70%',itemWidth: 10,itemHeight: 10,data:['0岁以下','20-29岁','30-39岁','40-49岁','50岁以上'],textStyle: {color: 'rgba(255,255,255,.5)',fontSize:'12',}},series: [{name:'年龄分布',type:'pie',center: ['50%', '42%'],radius: ['40%', '60%'],color: ['#065aab', '#066eab', '#0682ab', '#0696ab', '#06a0ab','#06b4ab','#06c8ab','#06dcab','#06f0ab'],	label: {show:false},labelLine: {show:false},data:[{value:1, name:'0岁以下'},{value:4, name:'20-29岁'},{value:2, name:'30-39岁'},{value:2, name:'40-49岁'},{value:1, name:'50岁以上'},]}]
};// 使用刚指定的配置项和数据显示图表。myChart.setOption(option);window.addEventListener("resize", function () {myChart.resize();});}function echarts_32() {// 基于准备好的dom,初始化echarts实例var myChart = echarts.init(document.getElementById('fb2'));option = {title: [{text: '职业分布',left: 'center',textStyle: {color: '#fff',fontSize: '16'}}],tooltip: {trigger: 'item',formatter: "{a} <br/>{b}: {c} ({d}%)",
position:function(p){   //其中p为当前鼠标的位置return [p[0] + 10, p[1] - 10];}},legend: {top:'70%',itemWidth: 10,itemHeight: 10,data:['电子商务','教育','IT/互联网','金融','学生','其他'],textStyle: {color: 'rgba(255,255,255,.5)',fontSize:'12',}},series: [{name:'职业分布',type:'pie',center: ['50%', '42%'],radius: ['40%', '60%'],color: ['#065aab', '#066eab', '#0682ab', '#0696ab', '#06a0ab','#06b4ab','#06c8ab','#06dcab','#06f0ab'],	label: {show:false},labelLine: {show:false},data:[{value:5, name:'电子商务'},{value:1, name:'教育'},{value:6, name:'IT/互联网'},{value:2, name:'金融'},{value:1, name:'学生'},{value:1, name:'其他'},]}]
};// 使用刚指定的配置项和数据显示图表。myChart.setOption(option);window.addEventListener("resize", function () {myChart.resize();});}function echarts_33() {// 基于准备好的dom,初始化echarts实例var myChart = echarts.init(document.getElementById('fb3'));option = {title: [{text: '兴趣分布',left: 'center',textStyle: {color: '#fff',fontSize: '16'}}],tooltip: {trigger: 'item',formatter: "{a} <br/>{b}: {c} ({d}%)",
position:function(p){   //其中p为当前鼠标的位置return [p[0] + 10, p[1] - 10];}},legend: {top:'70%',itemWidth: 10,itemHeight: 10,data:['汽车','旅游','财经','教育','软件','其他'],textStyle: {color: 'rgba(255,255,255,.5)',fontSize:'12',}},series: [{name:'兴趣分布',type:'pie',center: ['50%', '42%'],radius: ['40%', '60%'],color: ['#065aab', '#066eab', '#0682ab', '#0696ab', '#06a0ab','#06b4ab','#06c8ab','#06dcab','#06f0ab'],	label: {show:false},labelLine: {show:false},data:[{value:2, name:'汽车'},{value:3, name:'旅游'},{value:1, name:'财经'},{value:4, name:'教育'},{value:8, name:'软件'},{value:1, name:'其他'},]}]
};// 使用刚指定的配置项和数据显示图表。myChart.setOption(option);window.addEventListener("resize", function () {myChart.resize();});}})//async_data();
function  async_data() {// 异步加载数据$.getJSON('json/echart1.json').done(function (data) {var myChart = echarts.init(document.getElementById('echart1'));myChart.setOption({series: [{data: data}]});});//end $.getJSON$.getJSON('json/echart2.json').done(function (data) {var myChart = echarts.init(document.getElementById('echart2'));myChart.setOption({xAxis: data["xAxis"],series:data["series"]});});  //end $.getJSON$.getJSON('json/echart4.json').done(function (data) {var myChart = echarts.init(document.getElementById('echart4'));myChart.setOption({legend: data["legend"],xAxis: data["xAxis"],series: data["series"]});});//end $.getJSON$.getJSON('json/echart5.json').done(function (data) {var myChart = echarts.init(document.getElementById('echart5'));myChart.setOption({dataset: data["dataset"]});});//end $.getJSON$.getJSON('json/echart6.json').done(function (data) {var myChart = echarts.init(document.getElementById('echart6'));myChart.setOption({legend: data["legend"],series: data["series"]});});//end $.getJSON$.getJSON('json/echart31.json').done(function (data) {var myChart = echarts.init(document.getElementById('fb1'));
//        console.log(data["legend"])myChart.setOption({title: data["title"],legend: data["legend"],series: data["series"]});});//end $.getJSON$.getJSON('json/echart32.json').done(function (data) {var myChart = echarts.init(document.getElementById('fb2'));
//        console.log(data["legend"])myChart.setOption({title: data["title"],legend: data["legend"],series: data["series"]});});//end $.getJSON$.getJSON('json/echart33.json').done(function (data) {var myChart = echarts.init(document.getElementById('fb3'));
//        console.log(data["legend"])myChart.setOption({title: data["title"],legend: data["legend"],series: data["series"]});});//end $.getJSON$.getJSON('json/common.json').done(function (data) {document.getElementById('total_pv').innerText = data["total_pv"]document.getElementById('total_income').innerText = data["total_income"]});//end $.getJSON
}
3、后端python代码
#author QQ "6550523" or weixin "6550523"
import _thread
import sys
from PyQt5.QtWidgets import *
from PyQt5.QtCore import *
from PyQt5.QtWebEngineWidgets import QWebEngineView
from pyecharts import Geo
from PyQt5.QtCore import QUrl
from win32api import GetSystemMetrics
from PyQt5 import QtGui
from httpserver import *
from asyncJson import *class MainWindow(QMainWindow):def __init__(self, *args, **kwargs):super().__init__(*args, **kwargs)self.loadfinished = Falseself.setWindowTitle('大屏展示')self.showMaximized()#全屏显示self.showFullScreen()self.isFullScreen = Trueself.webview = WebEngineView()# self.webview.load(QUrl("file:///index.html"))self.webview.load(QUrl("http://localhost:8888/index.html"))self.setCentralWidget(self.webview)QShortcut(QtGui.QKeySequence("Escape"), self, self.Esc)self.webview.loadFinished.connect(self.SetLoadFinished)_thread.start_new_thread(HttpServer, ())_thread.start_new_thread(self.ChangeData, ())def SetLoadFinished(self):self.loadfinished = True#按ESC全屏或缩小def Esc(self):if self.isFullScreen == True :self.isFullScreen = False#不加这句的话,标题栏就看不到了self.showNormal()#设置固定宽高self.setGeometry(GetSystemMetrics(0)/2, GetSystemMetrics(1)/2, 1280, 768)#再移动到屏幕中央screen = QDesktopWidget().screenGeometry()size = self.geometry()self.move((screen.width() - size.width()) / 2, (screen.height() - size.height()) / 2)else:self.showFullScreen()self.isFullScreen = Trueclass WebEngineView(QWebEngineView):windowList = []# 重写createwindow()def createWindow(self, QWebEnginePage_WebWindowType):new_webview =  WebEngineView()new_window = MainWindow()new_window.setCentralWidget(new_webview)#new_window.show()return new_webviewif __name__ == "__main__":app = QApplication(sys.argv)w = MainWindow()w.show()sys.exit(app.exec_())
四、上线运行
五、源码下载
【源码】数据可视化:基于Echarts+Python实现的动态实时大屏范例1-互联网企业数据分析.zip_python+echarts大屏-管理软件文档类资源-CSDN下载
注:源码包括python的webserver + json数据源码 + echarts
启动命令:打开cmd命令行,切换到案例根目录,运行 python httpserver.py
引用:基于互联网大牛的前端改进一下,做了个可执行程序,获取数据后更新到页面上。
精彩案例汇总
YYDatav的数据可视化《精彩案例汇总》_YYDataV的博客-CSDN博客
本次分享结束,欢迎讨论!QQ微信同号: 6550523