列表.sort(key=选择排序依据的函数,reverse=True|False)
参数key:要求传入一个函数,表示将列表的每一个元素传入函数当中,返回排序的依据,
参数reverse,是否反转排序结果,True降序,False升序
my_list = [["a", 33], ["b", 55], ["c", 11]]# 排序基于带名函数
def choose_sort_key(element):return element[1]# my_list.sort(key=choose_sort_key, reverse=True)# 通过lambda匿名函数来排序
my_list.sort(key=lambda element: element[1],reverse=True)
print(my_list)
from pyecharts.charts import Bar, Timeline
from pyecharts.options import *f = open("D:/1960-2019全球GDP数据.csv", "r", encoding="GB2312")
# 读取每一行
data = f.readlines()
f.close()
# 删除第一行无用数据
data.pop(0)data_dict = dict()
for line in data:year = int(line.split(",")[0]) # 年份country = line.split(",")[1] # 国家gpd = float(line.split(",")[2]) # gdp,科学计数法转换为floattry:data_dict[year].append([country, gpd])except KeyError:data_dict[year] = [] # 给字典添加一个键值对键值为year的值的[]的空集data_dict[year].append([country, gpd])timeline = Timeline()# 排序年份
sorted_year_list = sorted(data_dict.keys())
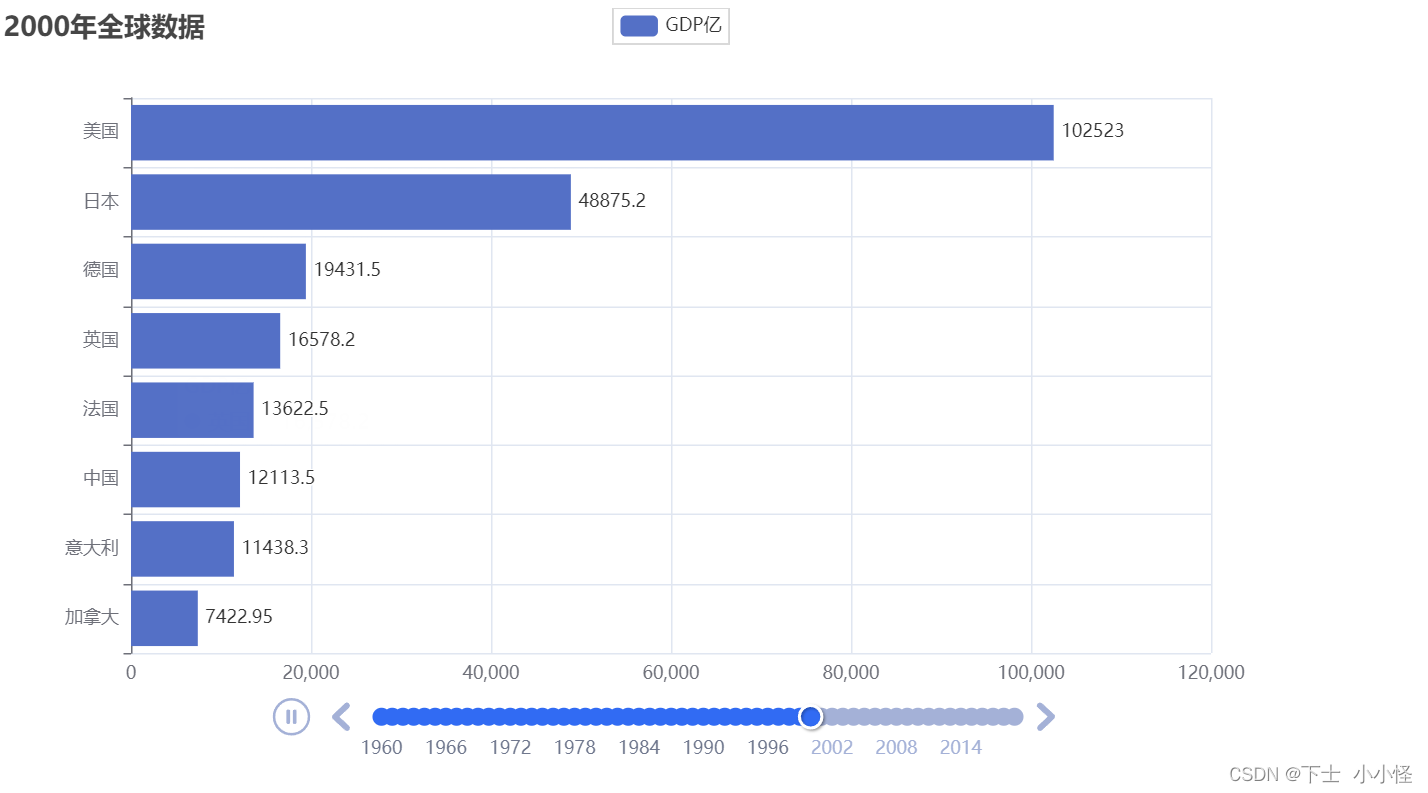
for year in sorted_year_list:data_dict[year].sort(key=lambda element: element[1], reverse=True)# 取出本年度排名前8的国家year_data = data_dict[year][0:8]x_data = []y_data = []for country_gap in year_data:x_data.append(country_gap[0]) # 在x轴添加国家y_data.append(country_gap[1] / 100000000) # 在y轴添加gdp数据bar = Bar()x_data.reverse() # 反转图标,gdp高的在上面y_data.reverse()bar.add_xaxis(x_data)bar.add_yaxis("GDP亿", y_data, label_opts=LabelOpts(position="right"))bar.reversal_axis()bar.set_global_opts(title_opts=TitleOpts(title=f"{year}年全球数据"))timeline.add(bar, str(year))timeline.add_schema(play_interval=1000,is_timeline_show=True,is_auto_play=True,is_loop_play=True
)timeline.render("动态GDP柱状图.html")