目录
1.Yolov8介绍
2.纸箱破损数据集介绍
2.1数据集划分
2.2 通过voc_label.py得到适合yolov8训练需要的
2.3生成内容如下
3.训练结果分析
1.Yolov8介绍
Ultralytics YOLOv8是Ultralytics公司开发的YOLO目标检测和图像分割模型的最新版本。YOLOv8是一种尖端的、最先进的(SOTA)模型,它建立在先前YOLO成功基础上,并引入了新功能和改进,以进一步提升性能和灵活性。它可以在大型数据集上进行训练,并且能够在各种硬件平台上运行,从CPU到GPU。
具体改进如下:
-
Backbone:使用的依旧是CSP的思想,不过YOLOv5中的C3模块被替换成了C2f模块,实现了进一步的轻量化,同时YOLOv8依旧使用了YOLOv5等架构中使用的SPPF模块;
-
PAN-FPN:毫无疑问YOLOv8依旧使用了PAN的思想,不过通过对比YOLOv5与YOLOv8的结构图可以看到,YOLOv8将YOLOv5中PAN-FPN上采样阶段中的卷积结构删除了,同时也将C3模块替换为了C2f模块;
-
Decoupled-Head:是不是嗅到了不一样的味道?是的,YOLOv8走向了Decoupled-Head;
-
Anchor-Free:YOLOv8抛弃了以往的Anchor-Base,使用了Anchor-Free的思想;
-
损失函数:YOLOv8使用VFL Loss作为分类损失,使用DFL Loss+CIOU Loss作为分类损失;
-
样本匹配:YOLOv8抛弃了以往的IOU匹配或者单边比例的分配方式,而是使用了Task-Aligned Assigner匹配方式

框架图提供见链接:Brief summary of YOLOv8 model structure · Issue #189 · ultralytics/ultralytics · GitHub
2.纸箱破损数据集介绍
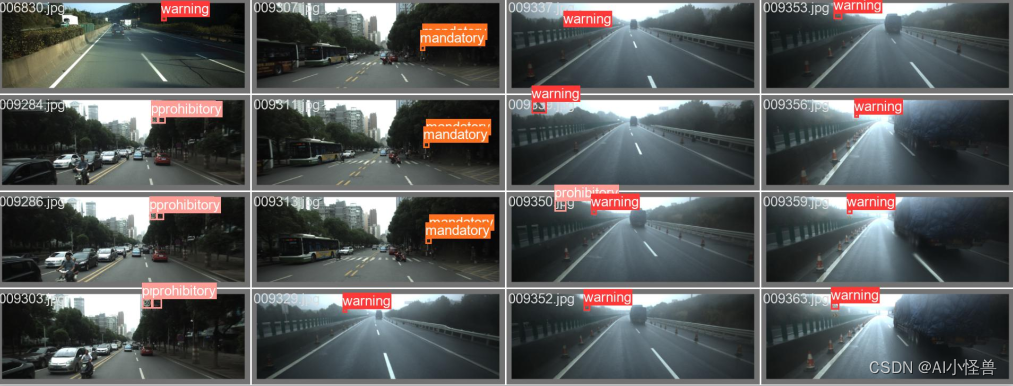
道路破损数据集大小13829,类别一类:warning、prohibitory、mandatory,按照8:1:1进行数据集随机生成。
2.1数据集划分
通过split_train_val.py得到trainval.txt、val.txt、test.txt
# coding:utf-8import os
import random
import argparseparser = argparse.ArgumentParser()
#xml文件的地址,根据自己的数据进行修改 xml一般存放在Annotations下
parser.add_argument('--xml_path', default='Annotations', type=str, help='input xml label path')
#数据集的划分,地址选择自己数据下的ImageSets/Main
parser.add_argument('--txt_path', default='ImageSets/Main', type=str, help='output txt label path')
opt = parser.parse_args()trainval_percent = 0.9
train_percent = 0.8
xmlfilepath = opt.xml_path
txtsavepath = opt.txt_path
total_xml = os.listdir(xmlfilepath)
if not os.path.exists(txtsavepath):os.makedirs(txtsavepath)num = len(total_xml)
list_index = range(num)
tv = int(num * trainval_percent)
tr = int(tv * train_percent)
trainval = random.sample(list_index, tv)
train = random.sample(trainval, tr)file_trainval = open(txtsavepath + '/trainval.txt', 'w')
file_test = open(txtsavepath + '/test.txt', 'w')
file_train = open(txtsavepath + '/train.txt', 'w')
file_val = open(txtsavepath + '/val.txt', 'w')for i in list_index:name = total_xml[i][:-4] + '\n'if i in trainval:file_trainval.write(name)if i in train:file_train.write(name)else:file_val.write(name)else:file_test.write(name)file_trainval.close()
file_train.close()
file_val.close()
file_test.close()
2.2 通过voc_label.py得到适合yolov8训练需要的
# -*- coding: utf-8 -*-
import xml.etree.ElementTree as ET
import os
from os import getcwdsets = ['train', 'val']
classes = ["warning","prohibitory","mandatory"]   # 改成自己的类别
abs_path = os.getcwd()
print(abs_path)def convert(size, box):dw = 1. / (size[0])dh = 1. / (size[1])x = (box[0] + box[1]) / 2.0 - 1y = (box[2] + box[3]) / 2.0 - 1w = box[1] - box[0]h = box[3] - box[2]x = x * dww = w * dwy = y * dhh = h * dhreturn x, y, w, hdef convert_annotation(image_id):in_file = open('Annotations/%s.xml' % (image_id), encoding='UTF-8')out_file = open('labels/%s.txt' % (image_id), 'w')tree = ET.parse(in_file)root = tree.getroot()size = root.find('size')w = int(size.find('width').text)h = int(size.find('height').text)for obj in root.iter('object'):difficult = obj.find('difficult').text#difficult = obj.find('Difficult').textcls = obj.find('name').textif cls not in classes or int(difficult) == 1:continuecls_id = classes.index(cls)xmlbox = obj.find('bndbox')b = (float(xmlbox.find('xmin').text), float(xmlbox.find('xmax').text), float(xmlbox.find('ymin').text),float(xmlbox.find('ymax').text))b1, b2, b3, b4 = b# 标注越界修正if b2 > w:b2 = wif b4 > h:b4 = hb = (b1, b2, b3, b4)bb = convert((w, h), b)out_file.write(str(cls_id) + " " + " ".join([str(a) for a in bb]) + '\n')wd = getcwd()
for image_set in sets:if not os.path.exists('labels/'):os.makedirs('labels/')image_ids = open('ImageSets/Main/%s.txt' % (image_set)).read().strip().split()list_file = open('%s.txt' % (image_set), 'w')for image_id in image_ids:list_file.write(abs_path + '/images/%s.jpg\n' % (image_id))convert_annotation(image_id)list_file.close()
2.3生成内容如下

3.训练结果分析
confusion_matrix.png :列代表预测的类别,行代表实际的类别。其对角线上的值表示预测正确的数量比例,非对角线元素则是预测错误的部分。混淆矩阵的对角线值越高越好,这表明许多预测是正确的。

上图是道路破损检测训练,有图可以看出 ,分别是破损和background FP。该图在每列上进行归一化处理。则可以看出破损检测预测正确的概率为91%。
F1_curve.png:F1分数与置信度(x轴)之间的关系。F1分数是分类的一个衡量标准,是精确率和召回率的调和平均函数,介于0,1之间。越大越好。
TP:真实为真,预测为真;
FN:真实为真,预测为假;
FP:真实为假,预测为真;
TN:真实为假,预测为假;
精确率(precision)=TP/(TP+FP)
召回率(Recall)=TP/(TP+FN)
F1=2*(精确率*召回率)/(精确率+召回率)

labels_correlogram.jpg :显示数据的每个轴与其他轴之间的对比。图像中的标签位于 xywh 空间。

labels.jpg :
(1,1)表示每个类别的数据量
(1,2)真实标注的 bounding_box
(2,1) 真实标注的中心点坐标
(2,2)真实标注的矩阵宽高

P_curve.png:表示准确率与置信度的关系图线,横坐标置信度。由下图可以看出置信度越高,准确率越高。

PR_curve.png :PR曲线中的P代表的是precision(精准率),R代表的是recall(召回率),其代表的是精准率与召回率的关系。

R_curve.png :召回率与置信度之间关系

预测结果:
