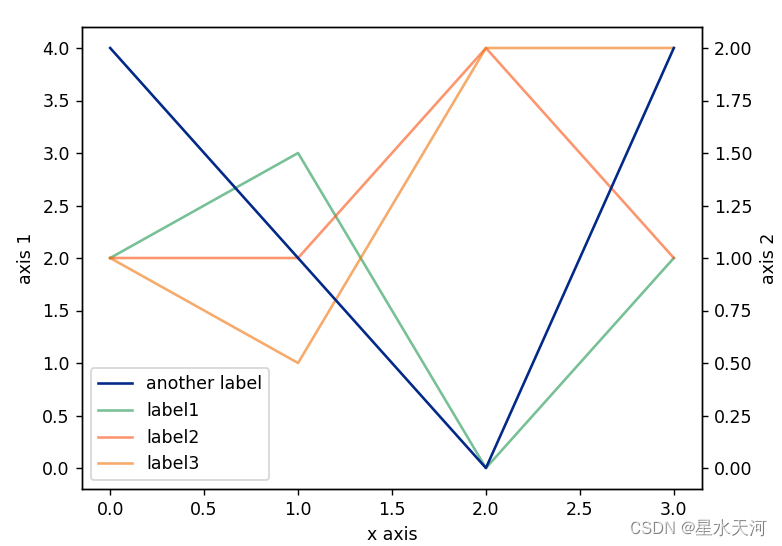
效果图:
代码:
由于使用了两组y axis,如果直接使用ax.legend绘制图例,会得到两个图例。而下面的代码将两个图例合并显示。
import matplotlib.pyplot as plt
import numpy as npdata = np.random.randint(low=0,high=5,size=(3,4))
fig, ax1 = plt.subplots()
color = [(33/255,158/255,188/255),(254/255,183/255,5/255),(250/255,134/255,0),(144/255,201/255,231/255)]
handle={}
for i in range(data.shape[0]):handle[i],=ax1.plot(np.arange(data.shape[1]),data[i],color=color[i],label=f'label{i+1}',alpha=0.6)
ax1.set_ylabel('axis1', color='k')
ax1.tick_params(axis='y', labelcolor='k')
ax2 = ax1.twinx()
data2 = np.random.randint(low=0,high=5,size=(1,4))
h1,=ax2.plot(np.arange(data2.shape[1]),data2[0],color=(2/255, 48/255, 146/255),label='another label')
ax1.set_xlabel('Time')
ax2.set_ylabel('axis2', color='k')
ax2.tick_params(axis='y', labelcolor='k')
plt.legend(handles=[h1,*handle.values()])
plt.show()
