需求
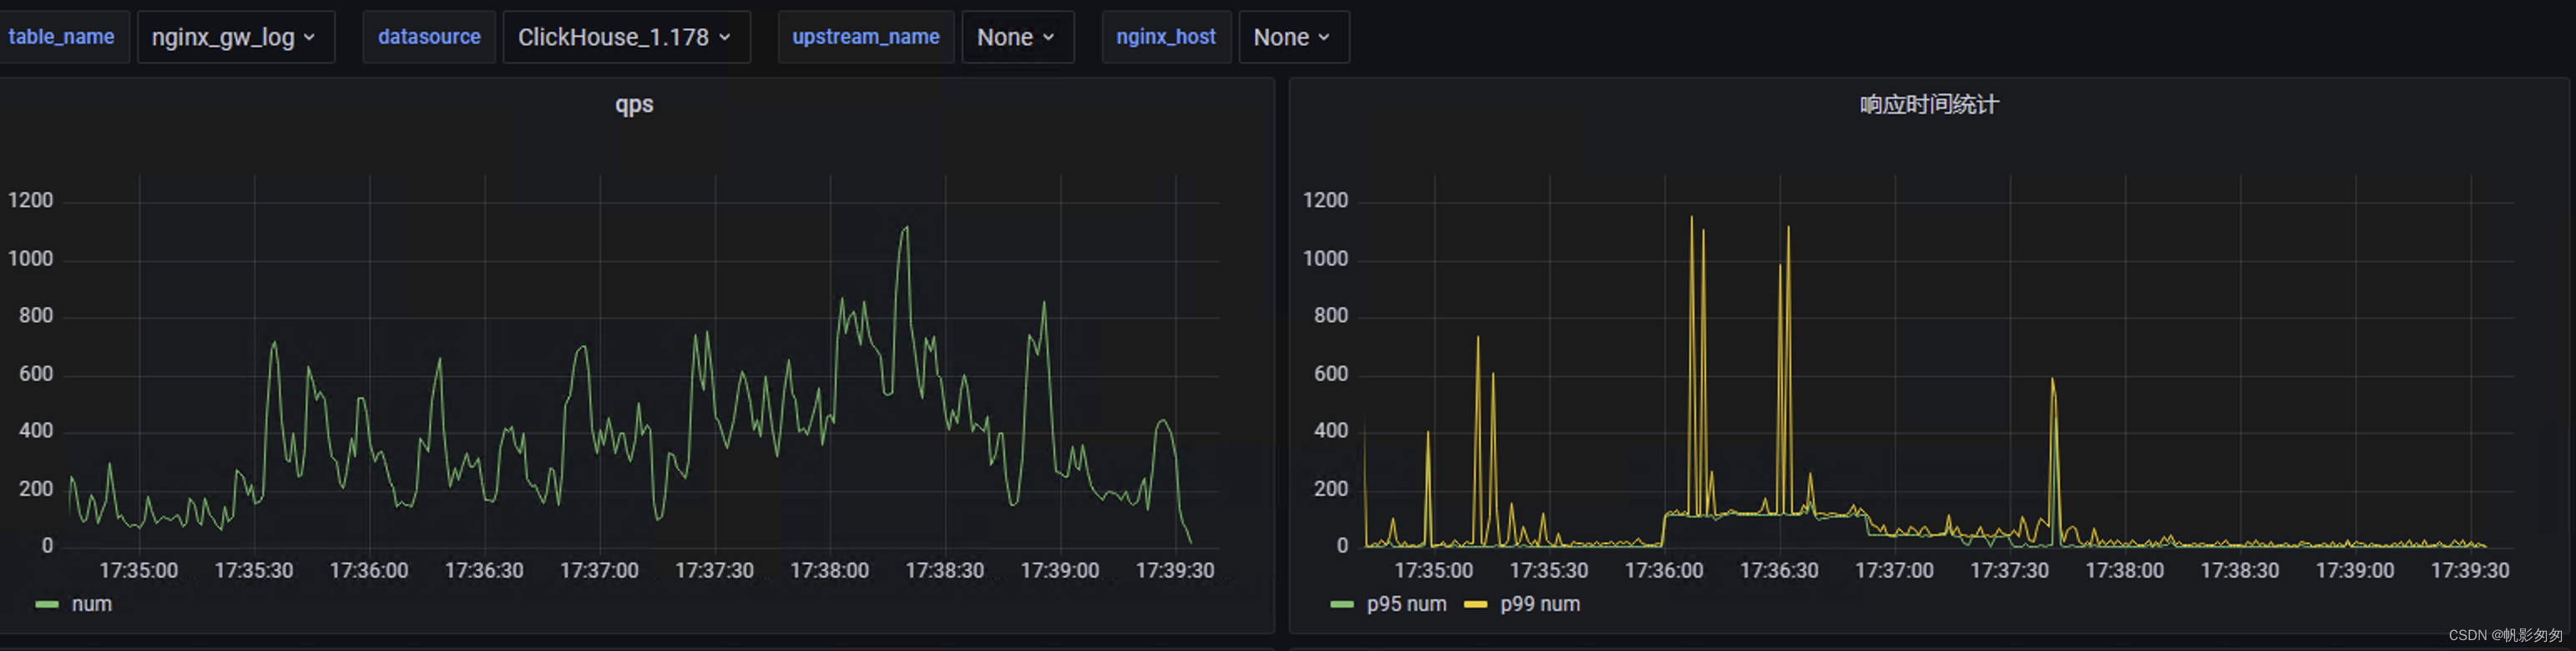
- 我想做一个类似腾讯云网关日志最终以仪表方式呈现,比如说qps、p99、p95的请求响应时间等等
流程图
数据流转就像标题
nginx ----> rsyslog ----> kafka —> clickhouse —> grafana
部署
kafka
kafka 相关部署这里不做赘述,只要创建一个topic 就可以
这里kafka地址是 192.168.1.180,topic是``
rsyslog 设置
rsyslog 具体是啥东西这个我这里也不做介绍,本人也是一个后端开发不是做运维的,只知道这个东西性能不错,算是logstash 平替把
# 安装rsyslog-kafka 插件
yum install -y rsyslog-kafka
# 创建一个配置vim /etc/rsyslog.d/rsyslog_nginx_kafka_cluster.conf
conf 内容
module(load="imudp")
input(type="imudp" port="514")# nginx access log ==> rsyslog server(local) ==> kafka
module(load="omkafka")template(name="nginxLog" type="string" string="%msg%")if $inputname == "imudp" then {# 这里的名字和下面nginx 配置tag 相同if ($programname == "nginx_access_log") thenaction(type="omkafka"template="nginxLog"# kafka 地址broker=["192.168.1.180:9092"]# topic 名字topic="rsyslog_nginx"partitions.auto="on"confParam=["socket.keepalive.enable=true"])
}:rawmsg, contains, "nginx_access_log" ~
最后重启rsyslog 即可
nginx
http 节点中设置如下
log_format jsonlog '{''"host": "$host",''"server_addr": "$server_addr",''"remote_addr":"$remote_addr",''"time_format":"$time_ms",''"time_sec":$times,''"timestamp":$timestamp,''"method":"$request_method",''"request_url":"$request_uri",''"status":$status,''"upstream_name":"$upstream_name",''"http_user_agent":"$http_user_agent",''"upstream_addr":"$upstream_addr",''"trace_id":"$http_traceid",''"upstream_status":"$upstream_status",''"upstream_response_time":"$upstream_response_time",''"request_time":$request_time,''"nginx_host":"$nginx_host"''}';# 配置rsyslog,tag 和上文rsyslog 中相同!!!access_log syslog:server=192.168.1.179,facility=local7,tag=nginx_access_log,severity=info jsonlog;#access_log /var/log/nginx/access.log jsonlog;
配置实际转发upstream
upstream testcontrol{server 192.168.10.123:8081;
}server {listen       18081;server_name  _;# 设置up nameset $upstream_name 'testcontrol';include /etc/nginx/conf/time.conf;location / {proxy_set_header traceid $http_traceid;proxy_set_header n-t $msec;#proxy_set_header X-Real-IP $remote_addr;proxy_pass http://testcontrol;}location ~ /status {stub_status   on;}
}
/etc/nginx/conf/time.conf; 配置
set $nginx_host '192.168.8.64';
if ($time_iso8601 ~ "^(\d{4})-(\d{2})-(\d{2})T(\d{2}):(\d{2}):(\d{2})") {set $year $1;set $month $2;set $day $3;set $hour $4;set $minutes $5;set $seconds $6;set $time_sec "$1-$2-$3 $4:$5:$6";}# 获取毫秒时间戳,并拼接到$time_zh之后if ($msec ~ "(\d+)\.(\d+)") {# 时间戳-msset $timestamp $1$2;# 时间戳-sset $times $1;# 格式化之后的时间msset $time_ms $time_sec.$2;# traceId,方便查日志set $http_traceid $nginx_host#$timestamp#$request_id;
}
clickhouse
先创建一个 nginx_gw_log 表
create table app_logs.nginx_gw_log
(timestamp              DateTime64(3, 'Asia/Shanghai'),server_addr            String,remote_addr            String,time_sec               DateTime('Asia/Shanghai'),method                 String,request_url            String,status                 Int16,upstream_name          String,http_user_agent        String,upstream_addr          String,trace_id               String,upstream_status        String,upstream_response_time String,request_time           Int32,nginx_host              String,host                   String
) engine = MergeTree PARTITION BY toYYYYMMDD(timestamp)ORDER BY timestampTTL toDateTime(timestamp) + toIntervalDay(1);
上面设置了过期1天,可以自由修改
添加kafka 引擎
create table app_logs.nginx_gw_log_kafka
(timestamp              DateTime64(3, 'Asia/Shanghai'),server_addr            String,remote_addr            String,time_sec               DateTime('Asia/Shanghai'),method                 String,request_url            String,status                 Int32,upstream_name          String,http_user_agent        String,upstream_addr          String,trace_id               String,upstream_status        String,upstream_response_time String,request_time           Decimal32(3),nginx_host              String,host                   String
) engine = Kafka()SETTINGS kafka_broker_list = '192.168.1.180:9092',kafka_topic_list = 'rsyslog_nginx',kafka_group_name = 'nginx_ck',kafka_format = 'JSONEachRow',kafka_skip_broken_messages = 100000,kafka_num_consumers = 1;
最后设置mv
CREATE MATERIALIZED VIEW app_logs.nginx_gw_log_mv TO app_logs.nginx_gw_log AS
SELECT timestamp,server_addr,remote_addr,time_sec,method,request_url,status,upstream_name,http_user_agent,upstream_addr,trace_id,upstream_status,upstream_response_time,toInt32(multiply(request_time, 1000)) as request_time,host
FROM app_logs.nginx_gw_log_kafka;
这里做了一个类型转换,因为nginx,request-time 单位是s,我想最终呈现在grafana 中是ms,所以这里做了转换,当然grafana中也可以做
上面都配置完了之后可以先验证下,保证数据最终到ck,如果有问题,需要再每个节点调试,比如先调试nginx->rsyslog ,可以先不配置kafka 输出,配置为console或者文件输出都可以,具体这里就不写了
grafana
{"annotations": {"list": [{"builtIn": 1,"datasource": {"type": "grafana","uid": "-- Grafana --"},"enable": true,"hide": true,"iconColor": "rgba(0, 211, 255, 1)","name": "Annotations & Alerts","target": {"limit": 100,"matchAny": false,"tags": [],"type": "dashboard"},"type": "dashboard"}]},"editable": true,"fiscalYearStartMonth": 0,"graphTooltip": 0,"id": 19,"links": [],"liveNow": false,"panels": [{"datasource": {"type": "grafana-clickhouse-datasource","uid": "${datasource}"},"fieldConfig": {"defaults": {"color": {"mode": "palette-classic"},"custom": {"axisCenteredZero": false,"axisColorMode": "text","axisLabel": "","axisPlacement": "auto","barAlignment": 0,"drawStyle": "line","fillOpacity": 0,"gradientMode": "none","hideFrom": {"legend": false,"tooltip": false,"viz": false},"lineInterpolation": "linear","lineWidth": 1,"pointSize": 5,"scaleDistribution": {"type": "linear"},"showPoints": "auto","spanNulls": false,"stacking": {"group": "A","mode": "none"},"thresholdsStyle": {"mode": "off"}},"mappings": [],"thresholds": {"mode": "absolute","steps": [{"color": "green","value": null},{"color": "red","value": 80}]}},"overrides": []},"gridPos": {"h": 9,"w": 12,"x": 0,"y": 0},"id": 2,"options": {"legend": {"calcs": [],"displayMode": "list","placement": "bottom","showLegend": true},"tooltip": {"mode": "single","sort": "none"}},"pluginVersion": "9.1.1","targets": [{"builderOptions": {"database": "app_logs","fields": [],"filters": [{"condition": "AND","filterType": "custom","key": "timestamp","operator": "WITH IN DASHBOARD TIME RANGE","restrictToFields": [{"label": "timestamp","name": "timestamp","picklistValues": [],"type": "DateTime64(3, 'Asia/Shanghai')"},{"label": "startTime","name": "startTime","picklistValues": [],"type": "DateTime64(3, 'Asia/Shanghai')"}],"type": "datetime"}],"groupBy": [],"limit": 100,"metrics": [{"aggregation": "count","field": ""}],"mode": "list","orderBy": [],"table": "tk_wx_control_req_kafka","timeField": "timestamp","timeFieldType": "DateTime64(3, 'Asia/Shanghai')"},"datasource": {"type": "grafana-clickhouse-datasource","uid": "${datasource}"},"format": 1,"meta": {"builderOptions": {"database": "app_logs","fields": [],"filters": [{"condition": "AND","filterType": "custom","key": "timestamp","operator": "WITH IN DASHBOARD TIME RANGE","restrictToFields": [{"label": "timestamp","name": "timestamp","picklistValues": [],"type": "DateTime64(3, 'Asia/Shanghai')"},{"label": "startTime","name": "startTime","picklistValues": [],"type": "DateTime64(3, 'Asia/Shanghai')"}],"type": "datetime"}],"groupBy": [],"limit": 100,"metrics": [{"aggregation": "count","field": ""}],"mode": "list","orderBy": [],"table": "tk_wx_control_req_kafka","timeField": "timestamp","timeFieldType": "DateTime64(3, 'Asia/Shanghai')"}},"queryType": "sql","rawSql": "SELECT time_sec as a, count() as num FROM \"app_logs\".${table_name} where ( timestamp  >= $__fromTime AND timestamp <= $__toTime )\r\ngroup by a order by a desc ;\r\n","refId": "A","selectedFormat": 4}],"title": "qps","type": "timeseries"},{"datasource": {"type": "grafana-clickhouse-datasource","uid": "${datasource}"},"fieldConfig": {"defaults": {"color": {"mode": "palette-classic"},"custom": {"axisCenteredZero": false,"axisColorMode": "text","axisLabel": "","axisPlacement": "auto","barAlignment": 0,"drawStyle": "line","fillOpacity": 0,"gradientMode": "none","hideFrom": {"legend": false,"tooltip": false,"viz": false},"lineInterpolation": "linear","lineWidth": 1,"pointSize": 5,"scaleDistribution": {"type": "linear"},"showPoints": "auto","spanNulls": false,"stacking": {"group": "A","mode": "none"},"thresholdsStyle": {"mode": "off"}},"mappings": [],"thresholds": {"mode": "absolute","steps": [{"color": "green","value": null},{"color": "red","value": 80}]}},"overrides": []},"gridPos": {"h": 9,"w": 12,"x": 12,"y": 0},"id": 3,"options": {"legend": {"calcs": [],"displayMode": "list","placement": "bottom","showLegend": true},"tooltip": {"mode": "single","sort": "none"}},"pluginVersion": "9.1.1","targets": [{"builderOptions": {"database": "app_logs","fields": [],"filters": [{"condition": "AND","filterType": "custom","key": "timestamp","operator": "WITH IN DASHBOARD TIME RANGE","restrictToFields": [{"label": "timestamp","name": "timestamp","picklistValues": [],"type": "DateTime64(3, 'Asia/Shanghai')"},{"label": "startTime","name": "startTime","picklistValues": [],"type": "DateTime64(3, 'Asia/Shanghai')"}],"type": "datetime"}],"groupBy": [],"limit": 100,"metrics": [{"aggregation": "count","field": ""}],"mode": "list","orderBy": [],"table": "tk_wx_control_req_kafka","timeField": "timestamp","timeFieldType": "DateTime64(3, 'Asia/Shanghai')"},"datasource": {"type": "grafana-clickhouse-datasource","uid": "${datasource}"},"format": 1,"meta": {"builderOptions": {"database": "app_logs","fields": [],"filters": [{"condition": "AND","filterType": "custom","key": "timestamp","operator": "WITH IN DASHBOARD TIME RANGE","restrictToFields": [{"label": "timestamp","name": "timestamp","picklistValues": [],"type": "DateTime64(3, 'Asia/Shanghai')"},{"label": "startTime","name": "startTime","picklistValues": [],"type": "DateTime64(3, 'Asia/Shanghai')"}],"type": "datetime"}],"groupBy": [],"limit": 100,"metrics": [{"aggregation": "count","field": ""}],"mode": "list","orderBy": [],"table": "tk_wx_control_req_kafka","timeField": "timestamp","timeFieldType": "DateTime64(3, 'Asia/Shanghai')"}},"queryType": "sql","rawSql": "SELECT time_sec as a, toInt32(quantile(0.95)(request_time))  as num FROM \"app_logs\".${table_name} where ( timestamp  >= $__fromTime AND timestamp <= $__toTime )\r\ngroup by a order by a desc ;","refId": "p95","selectedFormat": 4},{"builderOptions": {"database": "app_logs","fields": [],"filters": [{"condition": "AND","filterType": "custom","key": "timestamp","operator": "WITH IN DASHBOARD TIME RANGE","restrictToFields": [{"label": "timestamp","name": "timestamp","picklistValues": [],"type": "DateTime64(3, 'Asia/Shanghai')"},{"label": "startTime","name": "startTime","picklistValues": [],"type": "DateTime64(3, 'Asia/Shanghai')"}],"type": "datetime"}],"groupBy": [],"limit": 100,"metrics": [{"aggregation": "count","field": ""}],"mode": "list","orderBy": [],"table": "tk_wx_control_req_kafka","timeField": "timestamp","timeFieldType": "DateTime64(3, 'Asia/Shanghai')"},"datasource": {"type": "grafana-clickhouse-datasource","uid": "${datasource}"},"format": 1,"hide": false,"meta": {"builderOptions": {"database": "app_logs","fields": [],"filters": [{"condition": "AND","filterType": "custom","key": "timestamp","operator": "WITH IN DASHBOARD TIME RANGE","restrictToFields": [{"label": "timestamp","name": "timestamp","picklistValues": [],"type": "DateTime64(3, 'Asia/Shanghai')"},{"label": "startTime","name": "startTime","picklistValues": [],"type": "DateTime64(3, 'Asia/Shanghai')"}],"type": "datetime"}],"groupBy": [],"limit": 100,"metrics": [{"aggregation": "count","field": ""}],"mode": "list","orderBy": [],"table": "tk_wx_control_req_kafka","timeField": "timestamp","timeFieldType": "DateTime64(3, 'Asia/Shanghai')"}},"queryType": "sql","rawSql": "SELECT time_sec as a, toInt32(quantile(0.99)(request_time))  as num FROM \"app_logs\".${table_name} where ( timestamp  >= $__fromTime AND timestamp <= $__toTime )\r\ngroup by a order by a desc ;","refId": "p99","selectedFormat": 4}],"title": "响应时间统计","type": "timeseries"},{"datasource": {"type": "grafana-clickhouse-datasource","uid": "${datasource}"},"fieldConfig": {"defaults": {"color": {"mode": "thresholds"},"custom": {"align": "auto","displayMode": "auto","inspect": false},"mappings": [],"thresholds": {"mode": "absolute","steps": [{"color": "green","value": null},{"color": "red","value": 80}]}},"overrides": []},"gridPos": {"h": 9,"w": 12,"x": 0,"y": 9},"id": 4,"options": {"footer": {"fields": "","reducer": ["sum"],"show": false},"showHeader": true},"pluginVersion": "9.1.1","targets": [{"builderOptions": {"database": "app_logs","fields": [],"filters": [{"condition": "AND","filterType": "custom","key": "timestamp","operator": "WITH IN DASHBOARD TIME RANGE","restrictToFields": [{"label": "timestamp","name": "timestamp","picklistValues": [],"type": "DateTime64(3, 'Asia/Shanghai')"},{"label": "startTime","name": "startTime","picklistValues": [],"type": "DateTime64(3, 'Asia/Shanghai')"}],"type": "datetime"}],"groupBy": [],"limit": 100,"metrics": [{"aggregation": "count","field": ""}],"mode": "list","orderBy": [],"table": "tk_wx_control_req_kafka","timeField": "timestamp","timeFieldType": "DateTime64(3, 'Asia/Shanghai')"},"datasource": {"type": "grafana-clickhouse-datasource","uid": "${datasource}"},"format": 1,"meta": {"builderOptions": {"database": "app_logs","fields": [],"filters": [{"condition": "AND","filterType": "custom","key": "timestamp","operator": "WITH IN DASHBOARD TIME RANGE","restrictToFields": [{"label": "timestamp","name": "timestamp","picklistValues": [],"type": "DateTime64(3, 'Asia/Shanghai')"},{"label": "startTime","name": "startTime","picklistValues": [],"type": "DateTime64(3, 'Asia/Shanghai')"}],"type": "datetime"}],"groupBy": [],"limit": 100,"metrics": [{"aggregation": "count","field": ""}],"mode": "list","orderBy": [],"table": "tk_wx_control_req_kafka","timeField": "timestamp","timeFieldType": "DateTime64(3, 'Asia/Shanghai')"}},"queryType": "sql","rawSql": "SELECT request_time as k,request_url,trace_id  FROM \"app_logs\".${table_name} where ( timestamp  >= $__fromTime AND timestamp <= $__toTime )\r\n order by k desc limit 10;\r\n","refId": "A","selectedFormat": 4}],"title": "最耗时","type": "table"},{"datasource": {"type": "grafana-clickhouse-datasource","uid": "${datasource}"},"fieldConfig": {"defaults": {"color": {"mode": "thresholds"},"custom": {"align": "auto","displayMode": "auto","inspect": false},"mappings": [],"thresholds": {"mode": "absolute","steps": [{"color": "green","value": null},{"color": "red","value": 80}]}},"overrides": []},"gridPos": {"h": 9,"w": 12,"x": 12,"y": 9},"id": 5,"options": {"footer": {"fields": "","reducer": ["sum"],"show": false},"showHeader": true},"pluginVersion": "9.1.1","targets": [{"builderOptions": {"database": "app_logs","fields": [],"filters": [{"condition": "AND","filterType": "custom","key": "timestamp","operator": "WITH IN DASHBOARD TIME RANGE","restrictToFields": [{"label": "timestamp","name": "timestamp","picklistValues": [],"type": "DateTime64(3, 'Asia/Shanghai')"},{"label": "startTime","name": "startTime","picklistValues": [],"type": "DateTime64(3, 'Asia/Shanghai')"}],"type": "datetime"}],"groupBy": [],"limit": 100,"metrics": [{"aggregation": "count","field": ""}],"mode": "list","orderBy": [],"table": "tk_wx_control_req_kafka","timeField": "timestamp","timeFieldType": "DateTime64(3, 'Asia/Shanghai')"},"datasource": {"type": "grafana-clickhouse-datasource","uid": "${datasource}"},"format": 1,"meta": {"builderOptions": {"database": "app_logs","fields": [],"filters": [{"condition": "AND","filterType": "custom","key": "timestamp","operator": "WITH IN DASHBOARD TIME RANGE","restrictToFields": [{"label": "timestamp","name": "timestamp","picklistValues": [],"type": "DateTime64(3, 'Asia/Shanghai')"},{"label": "startTime","name": "startTime","picklistValues": [],"type": "DateTime64(3, 'Asia/Shanghai')"}],"type": "datetime"}],"groupBy": [],"limit": 100,"metrics": [{"aggregation": "count","field": ""}],"mode": "list","orderBy": [],"table": "tk_wx_control_req_kafka","timeField": "timestamp","timeFieldType": "DateTime64(3, 'Asia/Shanghai')"}},"queryType": "sql","rawSql": "SELECT request_url, count() as num FROM \"app_logs\".${table_name} where ( timestamp  >= $__fromTime AND timestamp <= $__toTime )\r\ngroup by request_url order by request_url desc ;","refId": "A","selectedFormat": 4}],"title": "接口请求数量","type": "table"},{"datasource": {"type": "grafana-clickhouse-datasource","uid": "${datasource}"},"fieldConfig": {"defaults": {"custom": {"align": "auto","displayMode": "auto","inspect": false},"mappings": [],"thresholds": {"mode": "absolute","steps": [{"color": "green","value": null},{"color": "red","value": 80}]}},"overrides": []},"gridPos": {"h": 9,"w": 12,"x": 0,"y": 18},"id": 6,"options": {"footer": {"fields": "","reducer": ["sum"],"show": false},"showHeader": true},"pluginVersion": "9.1.1","targets": [{"builderOptions": {"database": "app_logs","fields": [],"filters": [{"condition": "AND","filterType": "custom","key": "timestamp","operator": "WITH IN DASHBOARD TIME RANGE","restrictToFields": [{"label": "timestamp","name": "timestamp","picklistValues": [],"type": "DateTime64(3, 'Asia/Shanghai')"},{"label": "startTime","name": "startTime","picklistValues": [],"type": "DateTime64(3, 'Asia/Shanghai')"}],"type": "datetime"}],"groupBy": [],"limit": 100,"metrics": [{"aggregation": "count","field": ""}],"mode": "list","orderBy": [],"table": "tk_wx_control_req_kafka","timeField": "timestamp","timeFieldType": "DateTime64(3, 'Asia/Shanghai')"},"datasource": {"type": "grafana-clickhouse-datasource","uid": "${datasource}"},"format": 1,"meta": {"builderOptions": {"database": "app_logs","fields": [],"filters": [{"condition": "AND","filterType": "custom","key": "timestamp","operator": "WITH IN DASHBOARD TIME RANGE","restrictToFields": [{"label": "timestamp","name": "timestamp","picklistValues": [],"type": "DateTime64(3, 'Asia/Shanghai')"},{"label": "startTime","name": "startTime","picklistValues": [],"type": "DateTime64(3, 'Asia/Shanghai')"}],"type": "datetime"}],"groupBy": [],"limit": 100,"metrics": [{"aggregation": "count","field": ""}],"mode": "list","orderBy": [],"table": "tk_wx_control_req_kafka","timeField": "timestamp","timeFieldType": "DateTime64(3, 'Asia/Shanghai')"}},"queryType": "sql","rawSql": "SELECT DISTINCT host  FROM \"app_logs\".${table_name} where ( timestamp  >= $__fromTime AND timestamp <= $__toTime );\r\n","refId": "A","selectedFormat": 4}],"title": "upstream","type": "table"},{"datasource": {"type": "grafana-clickhouse-datasource","uid": "${datasource}"},"fieldConfig": {"defaults": {"custom": {"align": "auto","displayMode": "auto","inspect": false},"mappings": [],"thresholds": {"mode": "absolute","steps": [{"color": "green","value": null},{"color": "red","value": 80}]}},"overrides": []},"gridPos": {"h": 9,"w": 12,"x": 12,"y": 18},"id": 8,"options": {"footer": {"fields": "","reducer": ["sum"],"show": false},"showHeader": true},"pluginVersion": "9.1.1","targets": [{"builderOptions": {"database": "app_logs","fields": [],"filters": [{"condition": "AND","filterType": "custom","key": "timestamp","operator": "WITH IN DASHBOARD TIME RANGE","restrictToFields": [{"label": "timestamp","name": "timestamp","picklistValues": [],"type": "DateTime64(3, 'Asia/Shanghai')"},{"label": "startTime","name": "startTime","picklistValues": [],"type": "DateTime64(3, 'Asia/Shanghai')"}],"type": "datetime"}],"groupBy": [],"limit": 100,"metrics": [{"aggregation": "count","field": ""}],"mode": "list","orderBy": [],"table": "tk_wx_control_req_kafka","timeField": "timestamp","timeFieldType": "DateTime64(3, 'Asia/Shanghai')"},"datasource": {"type": "grafana-clickhouse-datasource","uid": "${datasource}"},"format": 1,"meta": {"builderOptions": {"database": "app_logs","fields": [],"filters": [{"condition": "AND","filterType": "custom","key": "timestamp","operator": "WITH IN DASHBOARD TIME RANGE","restrictToFields": [{"label": "timestamp","name": "timestamp","picklistValues": [],"type": "DateTime64(3, 'Asia/Shanghai')"},{"label": "startTime","name": "startTime","picklistValues": [],"type": "DateTime64(3, 'Asia/Shanghai')"}],"type": "datetime"}],"groupBy": [],"limit": 100,"metrics": [{"aggregation": "count","field": ""}],"mode": "list","orderBy": [],"table": "tk_wx_control_req_kafka","timeField": "timestamp","timeFieldType": "DateTime64(3, 'Asia/Shanghai')"}},"queryType": "sql","rawSql": "SELECT  upstream_status,count() as num  FROM \"app_logs\".${table_name} where ( timestamp  >= $__fromTime AND timestamp <= $__toTime ) group by upstream_status;\r\n","refId": "A","selectedFormat": 4}],"title": "upstream","type": "table"},{"datasource": {"type": "grafana-clickhouse-datasource","uid": "${datasource}"},"fieldConfig": {"defaults": {"mappings": [],"thresholds": {"mode": "percentage","steps": [{"color": "green","value": null},{"color": "orange","value": 70},{"color": "red","value": 85}]}},"overrides": []},"gridPos": {"h": 9,"w": 12,"x": 12,"y": 27},"id": 7,"options": {"orientation": "auto","reduceOptions": {"calcs": ["lastNotNull"],"fields": "","values": false},"showThresholdLabels": false,"showThresholdMarkers": true},"pluginVersion": "9.1.1","targets": [{"builderOptions": {"database": "app_logs","fields": [],"filters": [{"condition": "AND","filterType": "custom","key": "timestamp","operator": "WITH IN DASHBOARD TIME RANGE","restrictToFields": [{"label": "timestamp","name": "timestamp","picklistValues": [],"type": "DateTime64(3, 'Asia/Shanghai')"},{"label": "startTime","name": "startTime","picklistValues": [],"type": "DateTime64(3, 'Asia/Shanghai')"}],"type": "datetime"}],"groupBy": [],"limit": 100,"metrics": [{"aggregation": "count","field": ""}],"mode": "list","orderBy": [],"table": "tk_wx_control_req_kafka","timeField": "timestamp","timeFieldType": "DateTime64(3, 'Asia/Shanghai')"},"datasource": {"type": "grafana-clickhouse-datasource","uid": "${datasource}"},"format": 1,"meta": {"builderOptions": {"database": "app_logs","fields": [],"filters": [{"condition": "AND","filterType": "custom","key": "timestamp","operator": "WITH IN DASHBOARD TIME RANGE","restrictToFields": [{"label": "timestamp","name": "timestamp","picklistValues": [],"type": "DateTime64(3, 'Asia/Shanghai')"},{"label": "startTime","name": "startTime","picklistValues": [],"type": "DateTime64(3, 'Asia/Shanghai')"}],"type": "datetime"}],"groupBy": [],"limit": 100,"metrics": [{"aggregation": "count","field": ""}],"mode": "list","orderBy": [],"table": "tk_wx_control_req_kafka","timeField": "timestamp","timeFieldType": "DateTime64(3, 'Asia/Shanghai')"}},"queryType": "sql","rawSql": "SELECT count()  FROM \"app_logs\".${table_name} where ( timestamp  >= $__fromTime AND timestamp <= $__toTime );\r\n","refId": "A","selectedFormat": 4}],"title": "请求总数","type": "gauge"}],"schemaVersion": 37,"style": "dark","tags": [],"templating": {"list": [{"current": {"selected": false,"text": "nginx_gw_log","value": "nginx_gw_log"},"datasource": {"type": "grafana-clickhouse-datasource","uid": "${datasource}"},"definition": "show  tables from app_logs where name = 'nginx_gw_log' ","hide": 0,"includeAll": false,"label": "table_name","multi": false,"name": "table_name","options": [],"query": "show  tables from app_logs where name = 'nginx_gw_log' ","refresh": 1,"regex": "","skipUrlSync": false,"sort": 0,"type": "query"},{"current": {"selected": false,"text": "ClickHouse_1.178","value": "ClickHouse_1.178"},"hide": 0,"includeAll": false,"label": "datasource","multi": false,"name": "datasource","options": [],"query": "grafana-clickhouse-datasource","queryValue": "","refresh": 1,"regex": "","skipUrlSync": false,"type": "datasource"},{"current": {"selected": true,"text": "atscontrol","value": "atscontrol"},"datasource": {"type": "grafana-clickhouse-datasource","uid": "${datasource}"},"definition": "select DISTINCT upstream_name from app_logs.nginx_gw_log","hide": 0,"includeAll": false,"label": "upstream_name","multi": false,"name": "upstream_name","options": [],"query": "select DISTINCT upstream_name from app_logs.nginx_gw_log","refresh": 2,"regex": "","skipUrlSync": false,"sort": 0,"type": "query"},{"current": {"isNone": true,"selected": false,"text": "None","value": ""},"datasource": {"type": "grafana-clickhouse-datasource","uid": "${datasource}"},"definition": "select DISTINCT nginx_host from app_logs.nginx_gw_log where upstream_name = \"$upstream_name\"","hide": 0,"includeAll": false,"label": "nginx_host","multi": false,"name": "nginx_host","options": [],"query": "select DISTINCT nginx_host from app_logs.nginx_gw_log where upstream_name = \"$upstream_name\"","refresh": 1,"regex": "","skipUrlSync": false,"sort": 0,"type": "query"}]},"time": {"from": "now-5m","to": "now"},"timepicker": {},"timezone": "","title": "nginx_gw","uid": "lZrbSYOIkA","version": 2,"weekStart": ""
}
最终呈现效果
隐患点
- clickhouse 本身查询qps 就不高,如果数据量很大可以考虑集群或者其他的存储,doris、es等等
- 不知道nginx+rsyslog 对性能有多少影响,目前测试单机nginx大几千的qps 都没啥问题
有其他更好方案的小伙伴留言哦