相关文章:链家全国房价数据分析 : 数据获取
上一回我们提到了用爬虫爬取链家的新楼盘和二手房数据信息,这回我们来看看如何对他们进行分析。
新楼盘数据分析
因为我们爬的时候是一个个城市爬的,现在我们要把他们合在一起,首先呢我们需要知道一共爬了哪些城市。
url='https://gz.fang.lianjia.com/loupan/pg1/'
html=getHTML(url)
selector=etree.HTML(html)
cities_name=selector.xpath('//div[@class="city-change animated"]/div[@class="fc-main clear"]//ul//li/div//a/text()')
with open('./loupan/city_names.txt','w',encoding='utf8') as f:f.write(','.join(cities_name))
这段代码就是爬虫中解析所有城市的代码,不过我最后把城市名存起来了。存起来是为了以后可能要用。
接下来读出城市名称,然后根据每个城市名称打开csv文件(因为当时存的时候就是以城市名来命名csv文件的),然后把他们合并到同一个dataframe里面。
df=pd.DataFrame()
for city in city_names:f=open('./loupan/'+city+'.csv','r',encoding='utf8')try:df_temp=pd.read_csv(f)except Exception as e:df_temp=pd.DataFrame()f.close()df_temp['city']=citydf=df.append(df_temp)
df.to_csv('./loupan/national.csv',encoding='utf8',index=False)
接下来我们对数据做一个可视化分析,这次我们用的是pyecharts这个可视化框架,pyecharts这个框架太强了,美观炫酷,支持的参数也比较多!第一次使用就惊艳到我了。
每个城市的新房数量
from pyecharts import Bar
city_count_series=df.groupby('city')['url'].count().sort_values(ascending=False)
city_count_x=city_count_series.index.tolist()
city_count_y=city_count_series.values.tolist()
city_count_bar=Bar('各城市新房数量')
city_count_bar.add('',x_axis=city_count_x,y_axis=city_count_y,is_label_show=True,is_datazoom_show=True,x_rotate=30)
city_count_bar

房源数量最多的是成都、西安、广州、重庆和武汉、杭州,在这个图中可能看不到,因为X轴太长了没有把所有的x轴显示出来,不过它有缩放的设置,缩放了之后就可以看到了。

除了广州之外都不是超一线城市,可以看出哪些具有发展潜力。
各城市新楼盘的房价
df_price_unit=df[df.show_price!=0 ]
df_price_total=df[df.total_price_start!=0]
price_avg_series=df_price_unit.groupby('city')['show_price'].mean().sort_values(ascending=False)
total_price_series=df_price_total.groupby('city')['total_price_start'].mean().sort_values(ascending=False)
price_avg_x=price_avg_series.index
price_avg_y=price_avg_series.values
total_price_x=total_price_series.index
total_price_y=total_price_series.values
price_avg_plot=Bar('各城市新房均价')
price_avg_plot.add('单位面积价格(元/平米)',x_axis=price_avg_x,y_axis=price_avg_y,is_label_show=True)
price_avg_plot.add('总价(万元/套)',x_axis=total_price_x,y_axis=total_price_y,is_label_show=True,is_datazoom_show=True,x_rotate=30)
price_avg_plot
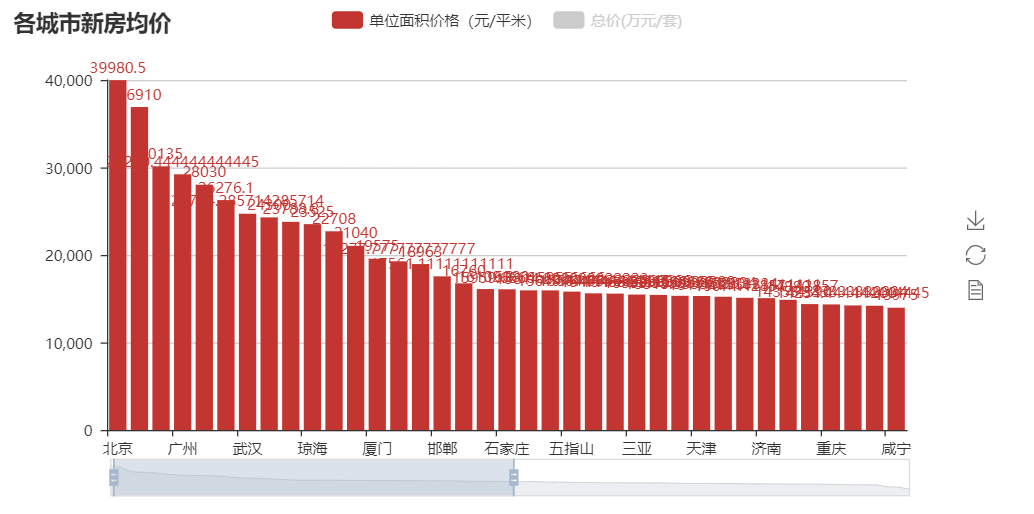
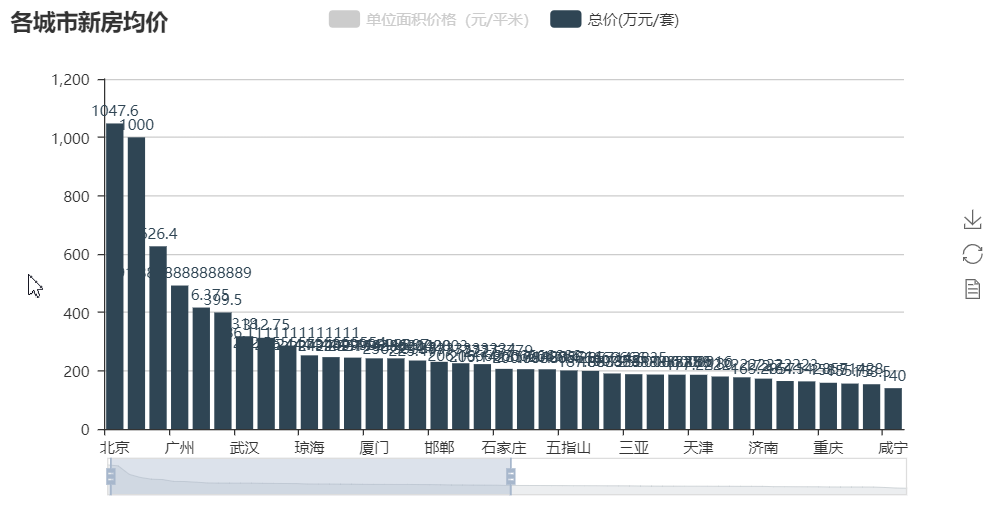
在剔除了0的数据之后,无论是单位面积价格还是总价,北京都遥遥领先,但是前三名却不是想象中的北上广,是北京、乐东、陵水。。这就很不符合直觉。
但是从整体上来看,还是能明显看出第一梯队和第二第三梯队的城市的。
新楼盘卧室数量分布
import re
bedroom=[]
for index,row in df.iterrows():try:bed_num=re.findall('\d+',row.converged_rooms)[0]except:bed_num=-1bedroom.append(bed_num)
df['bedroom']=bedroom
bedroom_plot_x=df.bedroom.value_counts().index
bedroom_plot_y=df.bedroom.value_counts().values
from pyecharts import Pie
bedroom_plot=Pie('新房卧室数量',width=900)
bedroom_plot.add(name='卧室数量',attr=bedroom_plot_x,value=bedroom_plot_y,center=[50,60],radius=[40,80],is_random=True,rosetype='radius',is_label_show=True)
bedroom_plot
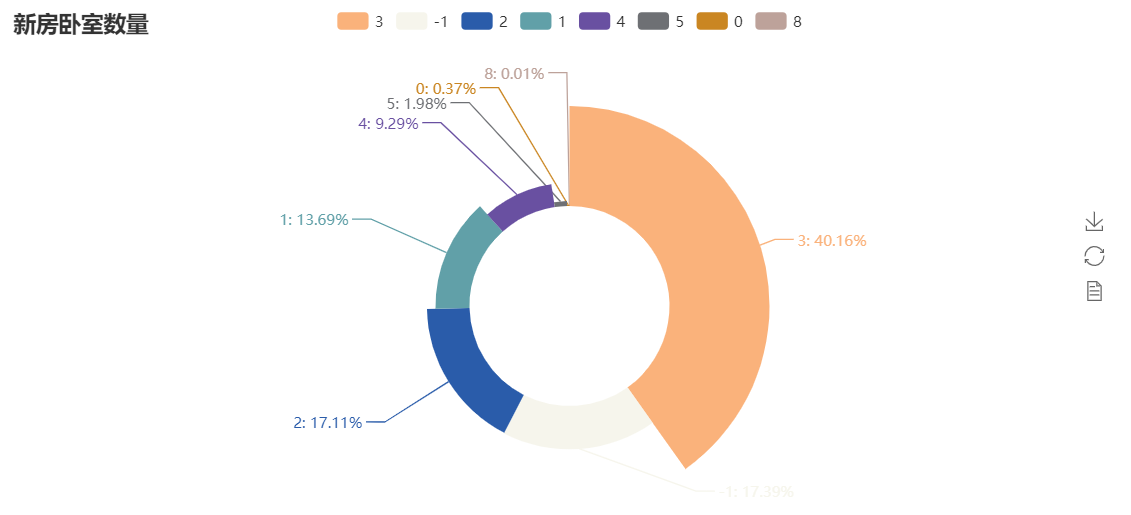
以3房为多,然后是2房,1房,-1的是没有提取到数据的。一般作为家庭居住的话,2房和3房还是比较实用的。
新楼盘标签印象
tags=[]
for index,row in df.iterrows():tag=row.tagstemp=tag.lstrip('[').rstrip(']').replace("'","").replace(' ','').split(',')if len(temp)>0:tags.extend(temp)
temp=pd.DataFrame()
temp['tag']=tags
word_series=temp.tag.value_counts()
word_name=word_series.index
word_value=word_series.values
from pyecharts import WordCloud
word_tag_plot=WordCloud('房屋标签词云')
word_tag_plot.add('',word_name,word_value,shape='circle',word_size_range=[20,70])
word_tag_plot

从中我们可以看出房地产商对新楼盘打的最多的标签是什么,也可以看出人们一个新房子最care的是什么。绿化率高、车位充足和品牌房企是出现最多的标签,原来那么多楼盘都用绿化做卖点的呀!其实我觉得买房子最重要的还是交通,有车的话要考虑车位是否充足,其他的都可以将就啦
楼盘的面积、类别和价格的关系
from pyecharts import Scatter3Dmapdict={'住宅':1,'商业类':2,'底商':3,'别墅':4,'商业':5,'写字楼':6}
def mapfunc(type):return mapdict[type]price=df.show_price.values.tolist()
price=[i/1000 for i in price]
area=df.max_frame_area.values.tolist()
types=list(map(mapfunc,df.house_type.values))data=[]
for i in range(len(price)):data.append([area[i],types[i],price[i]])
scatter=Scatter3D('价格,面积和房屋类型的关系',width=700,height=700)
scatter.add('',data,is_visualmap=True,grid3d_opacity=0.8,xaxis3d_max=650,yaxis3d_max=7,zaxis3d_max=120,xaxis3d_name='面积',yaxis3d_name='房屋类型',zaxis3d_name='单位价格',)
scatter
我先将楼盘的类型做了一个从字符串到数字的映射,以便在图中表示。在这里有三个因素,所以我将他们用三维散点图表示。
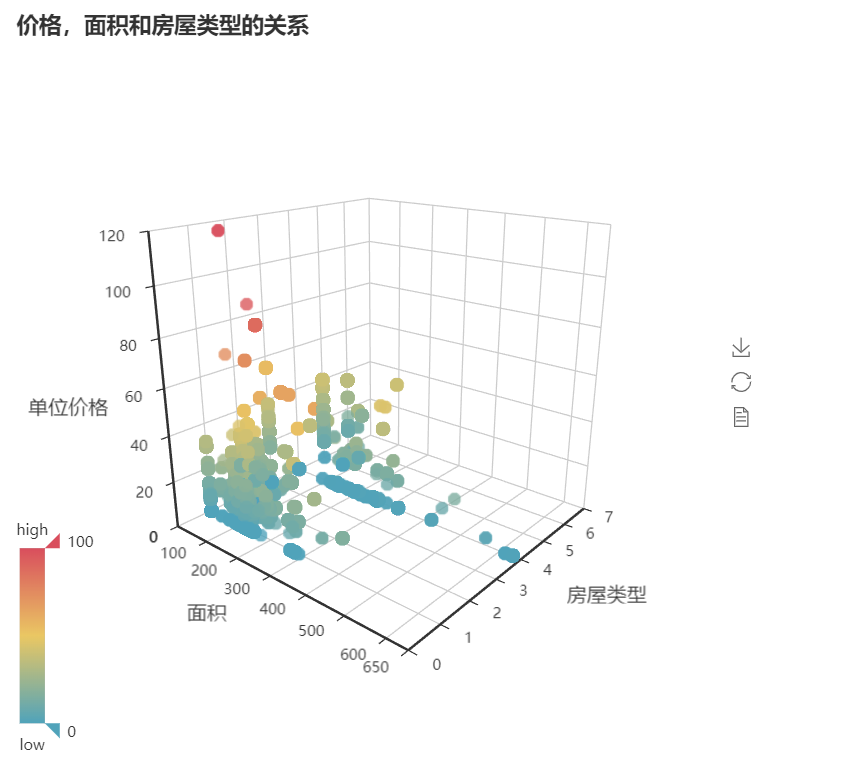
其实我也没有看出什么规律,单价并不是随着面积的增加而增加的,而是到达一个峰值之后逐渐回落,可能面积大的已经属于商业写字楼,其单位价格没有居住用楼贵。

各相关因素热力图
学习过机器学习的人都知道一个叫房屋价格预测的demo,就是由一些相关特征预测房屋的价格,可以采用线性回归模型,虽然不一定是用线性函数去拟合,要用到多项式拟合的。那么现在来看看各相关特征之间相关性如何
df['house_type_num']=df.house_type.apply(mapfunc)
df_heatmap=df[['average_price','avg_price_start','avg_unit_price','city_id','district_id','house_type_num','latitude','longitude','lowest_total_price','max_frame_area','min_frame_area','total_price_start']]
from pyecharts import HeatMap
heatmap=HeatMap('各因素相关性热力图',width=600,height=600)
heatmap_corr=df_heatmap.corr()
heatmap_data=[]
length=12
for i in range(length):for j in range(length):heatmap_data.append([i,j,heatmap_corr.iloc[i,j]])
heatmap.add('相关系数',heatmap_corr.columns.tolist(),heatmap_corr.columns.tolist(),heatmap_data,is_visualmap=True,visual_range=[-1,1],visual_orient='horizontal')
heatmap

可以看到,在avg_unit_price等几个价格指标中,大部分都是黄色以上,即趋向正相关,也说明使用线性回归是有效的。
就这么多吧。


