基于数据驱动的健康指标HI根据其构建策略的不同,常被分成两类,即:有量纲的物理指标和无量纲的虚拟指标。
有量纲的物理指标通常是由信号处理技术对收集到的时频域信号进行分析得到,常见的时域指标有均方根值、峰值指标、峰值因子、峭度因子、峰度因子、方根幅值、裕度系数、绝对平均值、脉冲因子及波形指标等。其中以均方根指标为例,其常被用来评估轴承的退化阶段、衡量轴承的退化趋势。此外,信号的频域指标诸如重心频率、均方频率、均方根频率、频率方差及频率标准差等时常也被用来衡量轴承的健康阶段。
无量纲的虚拟指标通常是由多个物理指标或者多源信号融合组成。常见的融合构成方式包括主成分分析、自组织映射、马氏距离、多层前向网络、隐马尔可夫模型等。上述的多个物理指标或多源信号的组合具有一定的冗余。因此,虚拟指标常通过一些升降维的方式提取重要特征并融合成所需的轴承健康状态退化指标。
鉴于此,本项目以均方根RMS、峭度kurtosis、均方根差分difference_rms和偏度差分difference_skewness为指标,构建健康指标HI:
sa_rms = rms(sa) ;sa_kurtosis = kurtosis(sa) ;difference_rms = rms(difference_sig) ;difference_skewness = skewness(difference_sig) ;sig_features = [sa_rms, sa_kurtosis, difference_rms, difference_skewness].' ;% HI calculationhi = mean(abs(sig_features - healthy_features_average)./healthy_features_std) ;hi_faulty_vctr(sig_num) = hi ;程序运行环境为MATLAB R2018A,所使用齿轮故障数据:
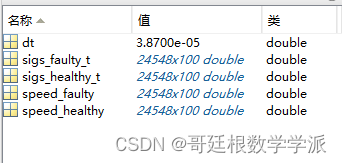
主代码:
% load data
load('gear.mat')
% processing of the healthy signals
num_healthy_sigs = size(sigs_healthy_t, 2) ; % number of healthy signals
healthy_features = zeros(4, num_healthy_sigs) ; % pre-allocation for the healthy features
for sig_num = 1 : num_healthy_sigssig_healthy = sigs_healthy_t(:, sig_num) ; % signal in the time domainspeed_faulty_t = speed_healthy(:, sig_num) ; % speed vector in the time domaint = [0 : dt : (length(sig_healthy)-1)*dt].' ; % time vector% angular resampling[sig_cyc, cyc_fs] = angular_resampling(t, speed_faulty_t, sig_healthy) ;num_pnts_in_round = cyc_fs ;% synchronous averagesa = calc_sa(sig_cyc, num_pnts_in_round) ;% difference signalgear_mesh = 38; num_sidebands = 2 ;difference_sig = calc_difference_signal(sa, gear_mesh, num_sidebands) ;% features extraction sa_rms = rms(sa) ;sa_kurtosis = kurtosis(sa) ;difference_rms = rms(difference_sig) ;difference_skewness = skewness(difference_sig) ;sig_features = [sa_rms, sa_kurtosis, difference_rms, difference_skewness].' ;healthy_features(:, sig_num) = sig_features ;end % of for% average and standard deviation of the healthy features
healthy_features_average = mean(healthy_features, 2) ;
healthy_features_std = std(healthy_features.').' ;healthy_hi_vctr = zeros(num_healthy_sigs, 1) ; % health indicator of the healthy signals
for sig_num = 1 : num_healthy_sigs% HI calculationhi = mean(abs(healthy_features(:, sig_num) - healthy_features_average)./healthy_features_std) ;healthy_hi_vctr(sig_num) = hi ;end % of for% processing of the faulty signals
num_faulty_sigs = size(sigs_faulty_t, 2) ; % number of faulty signals
hi_faulty_vctr = zeros(num_faulty_sigs, 1) ; % pre-allocation for the HI of the faulty signals
for sig_num = 1 : num_faulty_sigssig_faulty_t = sigs_faulty_t(:, sig_num) ; % signal in the time domainspeed_faulty_t = speed_faulty(:, sig_num) ; % speed vector in the time domaint = [0 : dt : (length(sig_faulty_t)-1)*dt].' ; % time vector% angular resampling[sig_cyc, cyc_fs] = angular_resampling(t, speed_faulty_t, sig_faulty_t) ;num_pnts_in_round = cyc_fs ;% synchronous averagesa = calc_sa(sig_cyc, num_pnts_in_round) ;% difference signalgear_mesh = 38; num_sidebands = 2 ;difference_sig = calc_difference_signal(sa, gear_mesh, num_sidebands) ;% features extraction sa_rms = rms(sa) ;sa_kurtosis = kurtosis(sa) ;difference_rms = rms(difference_sig) ;difference_skewness = skewness(difference_sig) ;sig_features = [sa_rms, sa_kurtosis, difference_rms, difference_skewness].' ;% HI calculationhi = mean(abs(sig_features - healthy_features_average)./healthy_features_std) ;hi_faulty_vctr(sig_num) = hi ;end % of for% ----------------------------------------------------------------------- %
% Part for figures
axis_font_size = 15 ;
title_font_size = 30 ;
axis_name_font_size = 25 ;
lgnd_font_size = 20 ;figure
plot([1:num_healthy_sigs], healthy_hi_vctr, 'LineWidth', 3, 'Color', 'g') ;
hold on
plot([num_healthy_sigs+1:num_healthy_sigs+num_faulty_sigs], hi_faulty_vctr, 'LineWidth', 3, 'Color', 'r') ;
hold off
ax = gca;
ax.FontSize = axis_font_size;
title('Health indicator of the healthy and faulty signals', 'FontName', 'Times New Roman', 'FontSize', title_font_size)
xlabel('Record number', 'FontName', 'Times New Roman', 'FontSize', axis_name_font_size)
ylabel('HI value', 'FontName', 'Times New Roman', 'FontSize', axis_name_font_size)
legend('Healthy records', 'Faulty records');
出图如下:
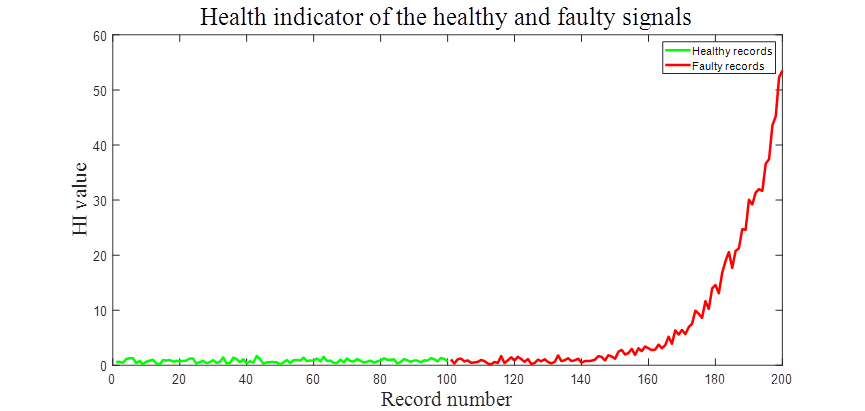
完整代码:MATLAB环境下基于健康指标(Health indicator)的齿轮故障诊断
擅长领域:现代信号处理,机器学习,深度学习,数字孪生,时间序列分析,设备缺陷检测、设备异常检测、设备智能故障诊断与健康管理PHM等。









![[linux]--关于进程概念(下)](https://img-blog.csdnimg.cn/direct/828df22432b94941b6573a8b1f5c9330.png)
![[游戏开发][UE5.3]GAS学习心得](https://img-blog.csdnimg.cn/direct/28b8a8018bc940eb807831998a6e15dc.png)
