python-数据可视化
** 数据可视化 指的是通过可视化表示来探索数据,它与数据挖掘**紧密相关,而数据挖掘指的是使用代码来探索数据集的规律和关联。数据集可以是用一行代码就能表示的小型数字列表,也可以是数以吉字节的数据
最流行的工具之一是matplotlib它是一个数学绘图库,我们将使用它来制作简单的图表,如折线图和散点图。然后,我们将基于随机漫步概念生成一个更有趣的数据集——根据一系列随机决策生成的图表。
我们还将使用Pygal包,它专注于生成适合在数字设备上显示的图表。可在用户与图表交互时突出元素以及调整其大小,还可轻松地调整整个图表的尺寸,使其适合在微型智能手表或巨型显示器上显示。
一、安装matplotlib
在Windows系统中,首先需要安装Visual Studio
参考:http://t.csdnimg.cn/336oy
在命令行窗口输入
pip install matplotlib
对安装进行测试。为此,首先使用命令python或python3启动一个终端会话,再尝试导入matplotlib:
$ python3
>>> import matplotlib
>>>
如果没有出现任何错误消息,就说明你的系统安装了matplotlib
matplotlib官网实例
Plot types — Matplotlib 3.9.0 documentation
二、使用matplotlib
折线图
1.pyplot()绘制简单的折线图
示例1:绘制简单的折线图
import matplotlib.pyplot as pltsquares = [1, 4, 9, 16, 25]
plt.plot(squares)
plt.show()
注意:在pycharm容易报错:
AttributeError: module ‘backend_interagg‘ has no attribute ‘FigureCanvas‘
这时需要修改某些参数,可以这样将上面文件第一行改为下面三行。
import matplotlib
matplotlib.use('TkAgg')
import matplotlib.pyplot as plt
2.定制折线图的通用参数
import matplotlib
matplotlib.use('TkAgg')
import matplotlib.pyplot as plt
import numpy as npsquares = [1, 4, 9, 16, 25]
# make data:
plt.plot(squares, linewidth=1)
#linewidth决定了plot()绘制的线条的粗细# 设置图表标题,并给坐标轴加上标签
plt.title("Number--graf", fontsize=24)
#函数title()给图表指定标题,fontsize指定了图表中文字的大小plt.xlabel("Value", fontsize=14)
plt.ylabel("Square of Value", fontsize=14)
#函数xlabel()和ylabel()让你能够为每条轴设置标题# 设置刻度标记的大小
plt.tick_params(axis='both', labelsize=14)
#函数tick_params()设置刻度的样式其中指定的实参将影响x轴和y轴上的刻度(axis='both'),并将刻度标记的字号设置为14(labelsize=14)。plt.show()
这样画出来的图像并不是完全正确的
原因在于当你向plot()提供一系列数字时,它假设第一个数据点对应的 x 坐标值为0
因此需要指定第一个点对应的 x 值为1,改变默认的行为
方法是给plot()同时提供输入值和输出值
plot()正确使用如下:
input_values = [1, 2, 3, 4, 5]
squares = [1, 4, 9, 16, 25]
plt.plot(input_values, squares, linewidth=5)
#第一个列表指定x轴的参数
#第二个列表指定y轴的参数
散点图
1.使用scatter()绘制散点图
plt.scatter(2, 4)
#使用`scatter()`,并向它传递一对 *x* 和 *y* 坐标,它将在指定位置绘制一个点
绘制一个点
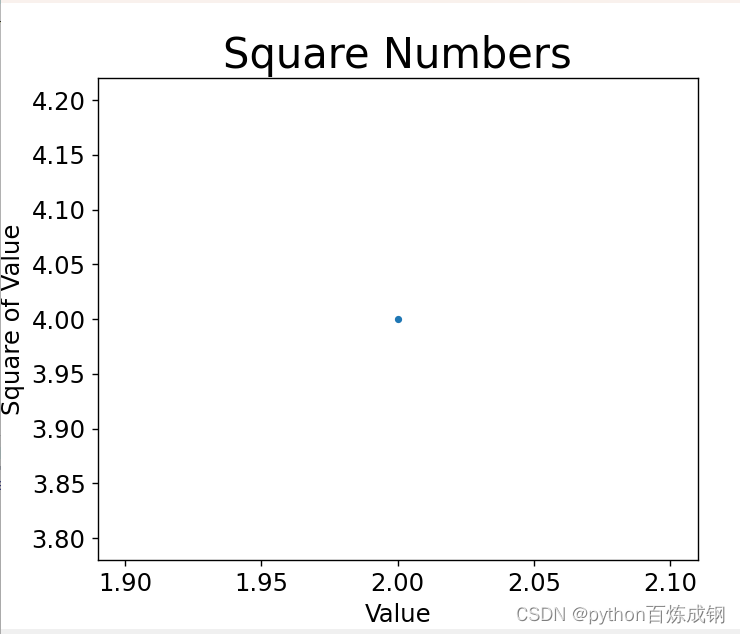
import matplotlib.pyplot as pltplt.scatter(2, 4,s=10)
#并使用实参s设置了绘制图形时使用的点的尺寸。# 设置图表标题并给坐标轴加上标签
plt.title("Square Numbers", fontsize=24)
plt.xlabel("Value", fontsize=14)
plt.ylabel("Square of Value", fontsize=14)# 设置刻度标记的大小
plt.tick_params(axis='both', which='major', labelsize=14)plt.show()
绘制一系列点
要绘制一系列的点,可向
scatter()传递两个分别包含x值和y值的列表
x_values = [1, 2, 3, 4, 5]
#横坐标的列表
y_values = [1, 4, 9, 16, 25]
#纵坐标的列表
plt.scatter(x_values, y_values, s=100)

使用for循环绘制一群点
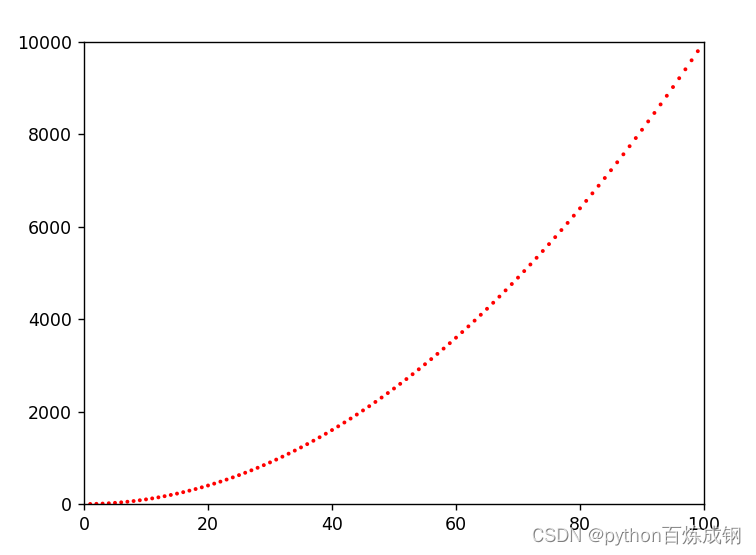
x_values = list(range(1,100))y_values =[i**2 for i in range(1,100)]
#方法同上
plt.scatter(x_values, y_values, s=5)plt.axis([0, 1100, 0, 1100000])
#函数axis()要求提供四个值:x(1-1100) 和 y(0-1100000) 坐标轴的最小值和最大值
scatter()的另一个参数
edgecolor=‘none’ 作用删除数据点的轮廓,默认蓝色
edgecolor=‘black’ 作用将数据点的轮廓线条改为黑色

plt.scatter(x_values, y_values, c='red',edgecolor = 'none',s=5)
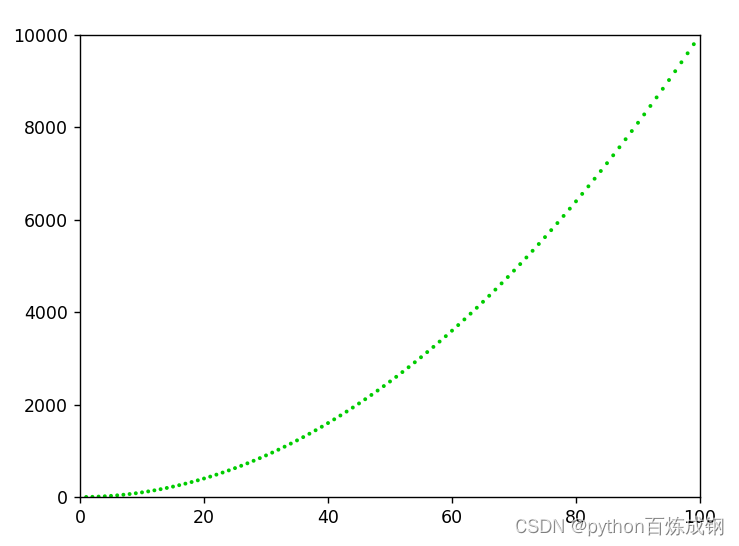
plt.scatter(x_values, y_values, c=(0, 0.8, 0),edgecolor = 'none',s=5)
#值越接近0,指定的颜色越深,值越接近1,指定的颜色越浅。
颜色映射
- 颜色映射(colormap)是一系列颜色,它们从起始颜色渐变到结束颜色。在可视化中,颜色映射用于突出数据的规律,例如,你可能用较浅的颜色来显示较小的值,并使用较深的颜色来显示较大的值。
模块pyplot内置了一组颜色映射。要使用这些颜色映射,你需要告诉pyplot该如何设置数据集中每个点的颜色。
plt.scatter(x_values, y_values, c=y_values, cmap=plt.cm.Blues, edgecolor='none', s=20)

参数c设置成了一个 y 值列表,并使用参数cmap告诉pyplot使用哪个颜色映射。这些代码将 y 值较小的点显示为浅蓝色,并将 y 值较大的点显示为深蓝色
自动保存图表
- 要让程序自动将图表保存到文件中,可将对
plt.show()的调用替换为对plt.savefig()的调用:
plt.savefig('squares_plot.png', bbox_inches='tight')
#第一个实参指定要以什么样的文件名保存图表,这个文件将存储到.py所在的目录中
#第二个实参指定将图表多余的空白区域裁剪掉。如果要保留图表周围多余的空白区域,可省略这个实参。
三、随机漫步
- 随机漫步是这样行走得到的路径:每次行走都完全是随机的,没有明确的方向,结果是由一系列随机决策决定的随机漫步就是蚂蚁在晕头转向的情况下,每次都沿随机的方向前行所经过的路径。
- 例如,漂浮在水滴上的花粉因不断受到水分子的挤压而在水面上移动。水滴中的分子运动是随机的,因此花粉在水面上的运动路径犹如随机漫步。
1.创建RandomWalk()类
为模拟随机漫步,我们将创建一个名为RandomWalk的类,它随机地选择前进方向。这个类需要三个属性,其中一个是存储随机漫步次数的变量,其他两个是列表,分别存储随机漫步经过的每个点的 x 和 y 坐标。
RandomWalk类只包含两个方法:__init__()和fill_walk(),其中后者计算随机漫步经过的所有点。
from random import choiceclass RandoWalk:def __init__(self,num_points=5000):self.num_points = num_pointsself.x_value = [0]self.y_value = [0]def fill_waik(self):while len(self.x_value)<self.num_points:x_derection = choice([-1,1])x_distance = choice([0,1,2,3,4])y_derection = choice([-1,1])y_distance = choice([0,1,2,3,4])x_step = x_distance*x_derectiony_step = y_distance*y_derectionif x_step==0 and y_step==0 :continuenext_x = self.x_value[-1]+x_stepnext_y = self.y_value[-1]+y_stepself.x_value.append(next_x)self.y_value.append(next_y)
import matplotlib
matplotlib.use('TkAgg')
import matplotlib.pyplot as plt
import numpy as np
import matplotlib.pyplot as plt
from RandomWalk import RandoWalkrw = RandoWalk()
rw.fill_waik()
plt.scatter(rw.x_value, rw.y_value, c='red', edgecolor='none', s=20)plt.show()

模拟多次随机漫步
每次随机漫步都不同,因此探索可能生成的各种模式很有趣。要在不多次运行程序的情况下使用前面的代码模拟多次随机漫步,一种办法是将这些代码放在一个while循环中,如下所示:
while True:# 创建一个RandomWalk实例,并将其包含的点都绘制出来rw = RandomWalk()rw.fill_walk()plt.scatter(rw.x_values, rw.y_values, s=15)plt.show()keep_running = input("Make another walk? (y/n): ") ❶if keep_running == 'n':break
point_numbers = list(range(rw.num_points))
plt.scatter(rw.x_value, rw.y_value,c=point_numbers, cmap=plt.cm.Blues, edgecolor='none', s=20)
#绘制时按先后次序着色,即生成的轨迹。

除了给随机漫步的各个点着色,以指出它们的先后顺序外,如果还能呈现随机漫步的起点和终点就更好了
plt.scatter(0, 0, c='green', edgecolors='none', s=100)
plt.scatter(rw.x_values[-1], rw.y_values[-1], c='red', edgecolors='none',s=100)
#单独绘制起点和终点,使其更加突出。
plt.axis('off')
#直接隐藏所有坐标轴信息plt.yticks([])
plt.xticks([])
#直接隐藏各坐标轴信息,但是有边框
 plt.figure(figsize=(10, 6))#函数figure()用于指定图表的宽度、高度、分辨率和背景色。你需要给形参figsize指定一个元组,向matplotlib指出绘图窗口的尺寸,单位为英寸。
plt.figure(dpi=128, figsize=(10, 6))
四、使用Pygal模拟掷骰子
- 使用Python可视化包Pygal来生成可缩放的矢量图形文件对于需要在尺寸不同的屏幕上显示的图表,这很有用,因为它们将自动缩放,以适合观看者的屏幕
1.安装pygal
在命令行窗口输入
python -m pip install --user pygal==1.7
示例:Line — pygal 2.0.0 documentation
2.创建一个Die()类
from random import randintclass Die:def __init__(self,num_size=6):self.num_size = num_sizedef roll(self):return randint(1,self.num_size)#返回一个1-6之间的随机数,返回起始值1、终止值num_sides或这两个值之间的任何整数!
3.模拟掷色子
import matplotlib
import pygal
from die import Die
matplotlib.use('TkAgg')
import matplotlib.pyplot as pltdie = Die()
values =[]for value in range(0,100):value = die.roll()values.append(value)consults = []
for value in range(1,die.num_size+1):value = values.count(value)consults.append(value)print(values)
print(consults)
4.绘制直方图
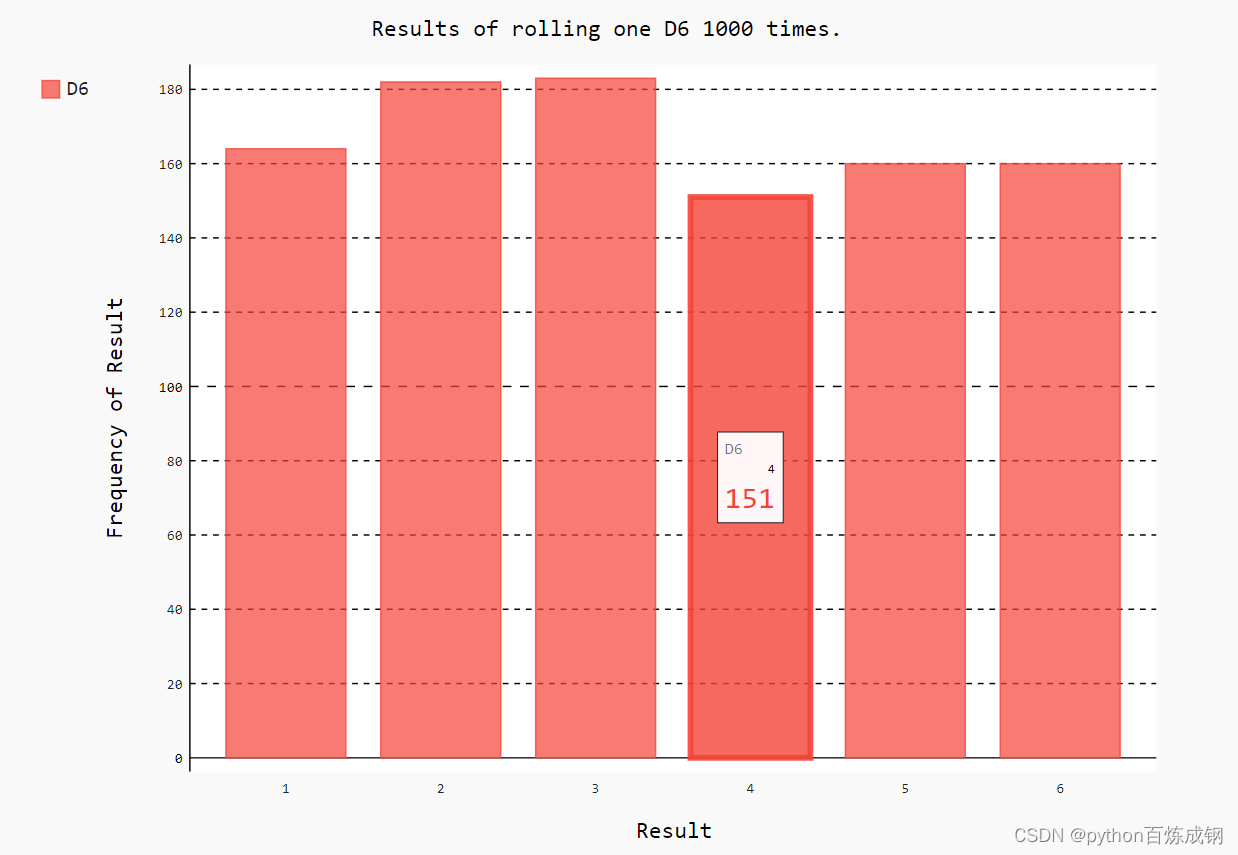
- 直方图是一种条形图,指出了各种结果出现的频率。
#创建一个pygal.Bar()实例
hist = pygal.Bar()hist.title = "Results of Rolling one D6 1000 times"
hist.x_lables = ['1','2','3','4','5','6']
hist.x_title = 'result'
hist.y_title = 'Frequency of Result'hist.add('D6',consults)
#add()将一系列值添加到图表中(向它传递要给添加的值指定的标签,还有一个列表,其中包含将出现在图表中的值)
hist.render_to_file('die_results.svg')
使用浏览器打开.svg文件
CVS数据-可视化
从网上下载某些数据,并对这些数据进行可视化,可视化以两种常见格式存储的数据:CSV和JSON。
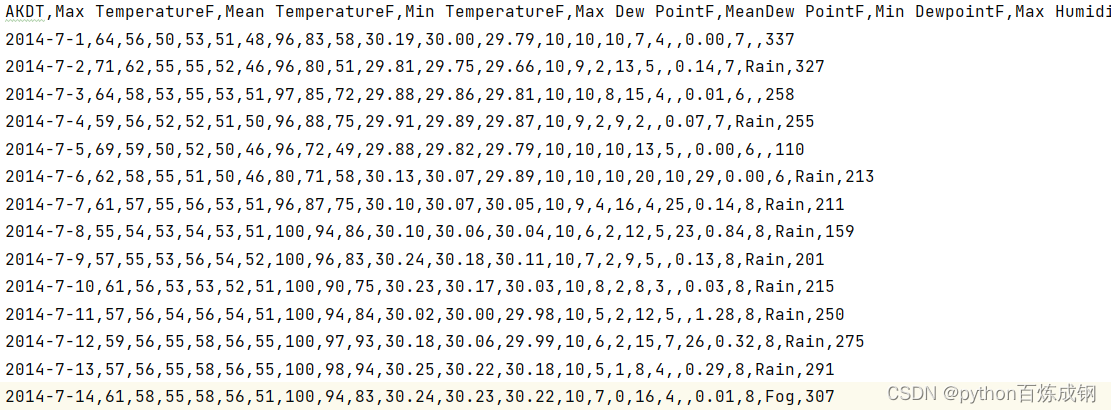
处理CVS数据-最简单的方式是将数据作为一系列以逗号分隔的值
提取CVS数据
import csvfilename = 'sitka_weather_07-2014.csv'
#存储使用的文件名with open(filename) as f:reader = csv.reader(f)#阅读器对象存储在reader中。header_row = next(reader)#模块csv包含函数next(),调用它并将阅读器对象传递给它时,它将返回文件中的下一行#调用了next()一次,因此得到的是文件的第一行print(header_row)#输出
#['AKDT', 'Max TemperatureF', 'Mean TemperatureF', 'Min TemperatureF', 'Max Dew PointF', 'MeanDew PointF', 'Min DewpointF', 'Max Humidity', ' Mean Humidity', ' Min Humidity', ' Max Sea Level PressureIn', ' Mean Sea Level PressureIn', ' Min Sea Level PressureIn', ' Max VisibilityMiles', ' Mean VisibilityMiles', ' Min VisibilityMiles', ' Max Wind SpeedMPH', ' Mean Wind SpeedMPH', ' Max Gust SpeedMPH', 'PrecipitationIn', ' CloudCover', ' Events', ' WindDirDegrees']#reader处理文件中以逗号分隔的第一行数据,并将每项数据都作为一个元素存储在列表中for index, column_header in enumerate(header_row):print(index+1,column_header)#可使用上述语句得到更详细的表头,对列表调用了enumerate()来获取每个元素的索引及其值
提取其中索引为0和1的值
#提取第二列为最高气温
with open(filename) as f:reader = csv.reader(f)header_row = next(reader)#已经读取了第一行,此时标志已经在第二行high = []for row in reader:high.append(row[1])#可以将row[1]转化为int(row[1])print(high)#对reader遍历是每一行组成的列表,且从第二行开始读取fig = plt.figure(dpi=128, figsize=(10, 6))plt.plot(date,high,c='red')plt.title("Daily high temperatures July 2014", fontsize=24)plt.xlabel("data", fontsize=16)plt.ylabel("Temperature (F)", fontsize=16)plt.tick_params(axis='both', which='major', labelsize=16)plt.show()#绘制最高气温折线图
模块datetime
在cvs文件中提取的日期为字符串,我们需要想办法将字符串'2014-7-1'转换为一个表示相应日期的对象。
可使用模块datetime中的方法strptime()。
导包
from datetime import datetime
如:将’2014-7-14’格式的字符串转化为对应的日期格式
first_date = datetime.strptime('2014-7-1', '%Y-%m-%d')
#datetime的方法strptime(),并将包含所需日期的字符串作为第一个实参。
#第二个实参告诉Python如何设置日期的格式。
- %Y-:让Python将字符串中第一个连字符前面的部分视为四位的年份
- %m-:将第二个连字符前面的部分视为表示月份的数字
- %d:将字符串的最后一部分视为月份中的一天(1~31)
- 其余如下:
| 实参 | 含义 |
|---|---|
%A | 星期的名称,如Monday |
%B | 月份名,如January |
%m | 用数字表示的月份(01~12) |
%d | 用数字表示月份中的一天(01~31) |
%Y | 四位的年份,如2015 |
%y | 两位的年份,如15 |
%H | 24小时制的小时数(00~23) |
%I | 12小时制的小时数(01~12) |
%p | am或pm |
%M | 分钟数(00~59) |
%S | 秒数(00~61) |
#读取第一列的日期high = []dateTimes = []for row in reader:high.append(int(row[1]))dateTime = datetime.strptime(row[0],'%Y-%m-%d')dateTimes.append(dateTime)fig = plt.figure(dpi=128, figsize=(10, 6))plt.plot(dateTimes,high,c='red')fig.autofmt_xdate()#调用fig.autofmt_xdate()来绘制斜的日期标签,以免它们彼此重叠
在绘制一个最低温
low = []
for row in reader:low.append(int(row[3]))plt.plot(dateTimes,low,c='blue')
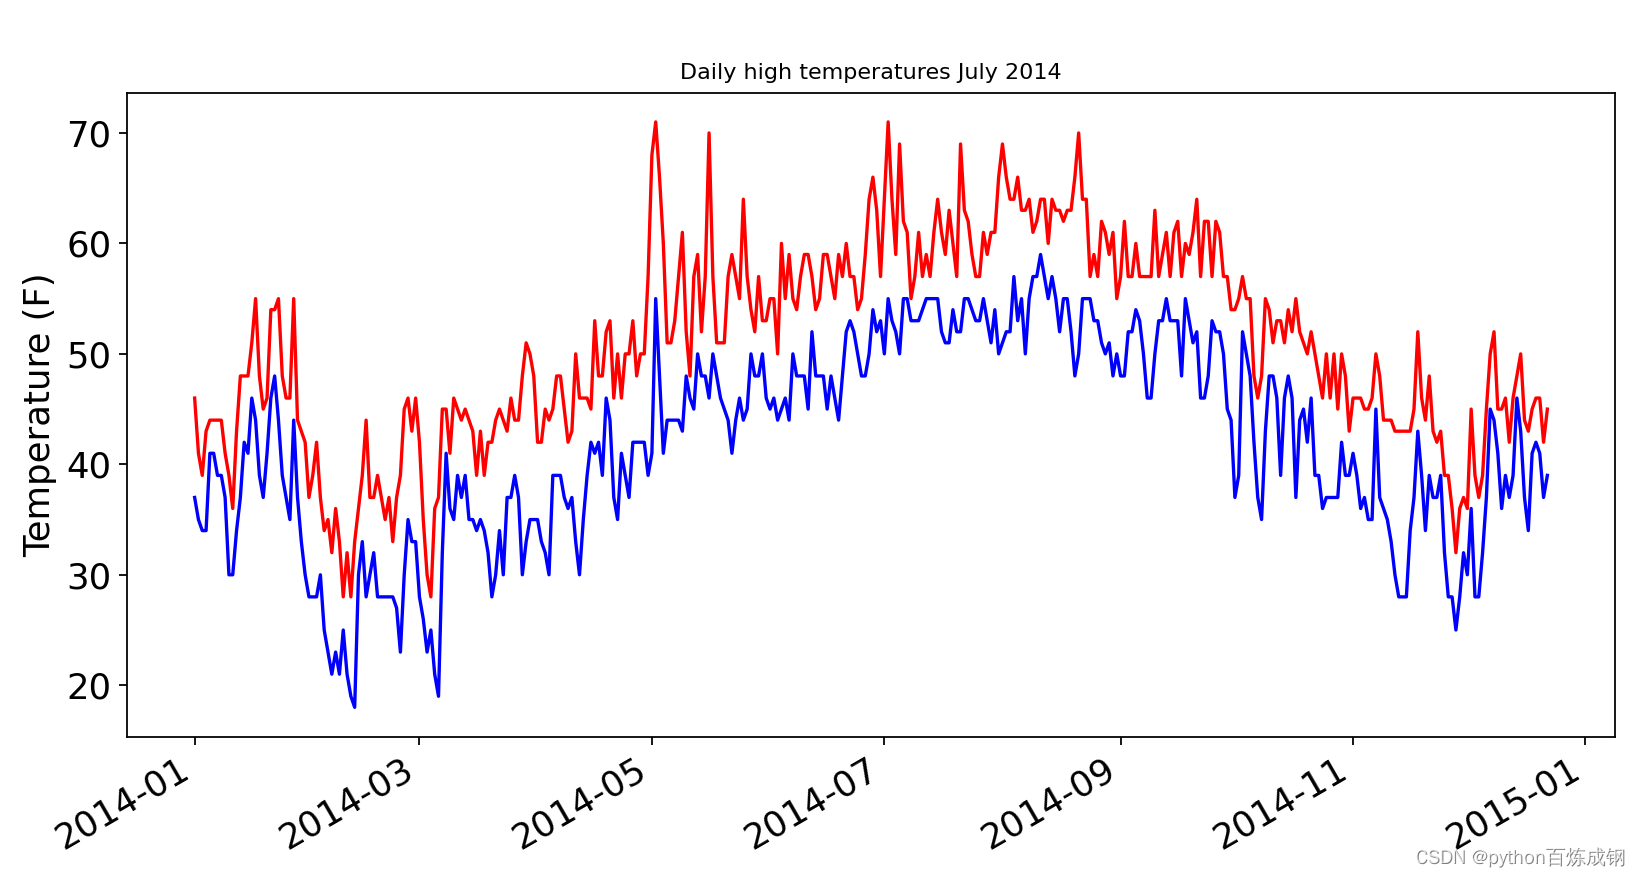
给中间区域着色
fill_between(),它接受一个 x 值系列和两个 y 值系列,并填充两个 y 值系列之间的空间
plt.fill_between(dateTimes,low,high,facecolor='grey', alpha=0.1)
#第一个参数为x值,第二三个参数为y值的最低和最高,facecolor为填充的颜色,alpha透明度0-1
JSON数据-可视化
- json文件实际上就是一个很长的Python列表,其中每个元素都是一个包含五个键的字典:统计日期、月份、周数、周几以及关闭价格。
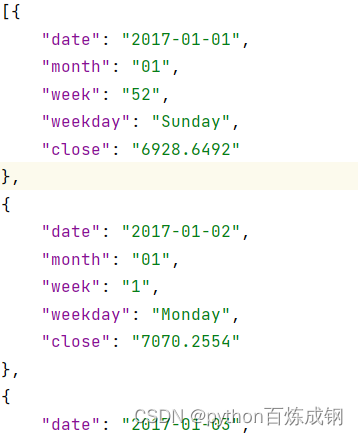
同时,介绍另一种数据文件获取渠道:从在线地址中获取json文件,需要用到工具:urlopen
import urlopen
import jsonjson_url = 'https://raw.githubusercontent.com/muxuezi/btc/master/btc_close_2017.json'
#给出数据的网络地址
response = urlopen(json_url)
# 读取数据
req = response.read()
# 将数据写入文件
with open('btc_close_2017_urllib.json','wb') as f: f.write(req)
# 加载json格式
file_urllib = json.loads(req)
print(file_urllib)
运行后即可将数据下载到btc_close_2017_urllib.json中
使用json数据
filename = 'btc_close_2017.json'
with open(filename) as f:btc_data = json.load(f)
#将文件中的数据存储在btc_data中#加载json格式
for btc_dict in btc_data:data = btc_dict['date']month = btc_dict['month']week = btc_dict['week']weekday = btc_dict['weekday']close = btc_dict['close']print("{} is month {} week {}, {}, the close price is {} RMB".format(data, month, week, weekday, close))
import pygal
import matplotlib
matplotlib.use('TkAgg')
import jsonfilename = 'btc_close_2017.json'
with open(filename) as f:btc_data = json.load(f)
#将文件中的数据存储在btc_data中
date = []
month = []
week = []
weekday =[]
close = []
#加载json格式
for btc_dict in btc_data:date.append(btc_dict['date'])month.append(btc_dict['month'])week.append(int(btc_dict['week']))weekday.append(btc_dict['weekday'])close.append(int(float(btc_dict['close'])))line_chart = pygal.Line(x_label_rotation=20, show_minor_x_labels=False)
#x_label_rotation=20让x 轴上的日期标签顺时针旋转20°,show_minor_x_labels=False则告诉图形不用显示所有的x 轴标签。line_chart.title = '收盘价(¥)'
line_chart.x_labels = date
N = 20 # x轴坐标每隔20天显示一次
line_chart.x_labels_major = date[::N]
#x_labels_major属性,让x 轴坐标每隔20天显示一次
line_chart.add('收盘价', close)
line_chart.render_to_file('收盘价折线图(¥).svg')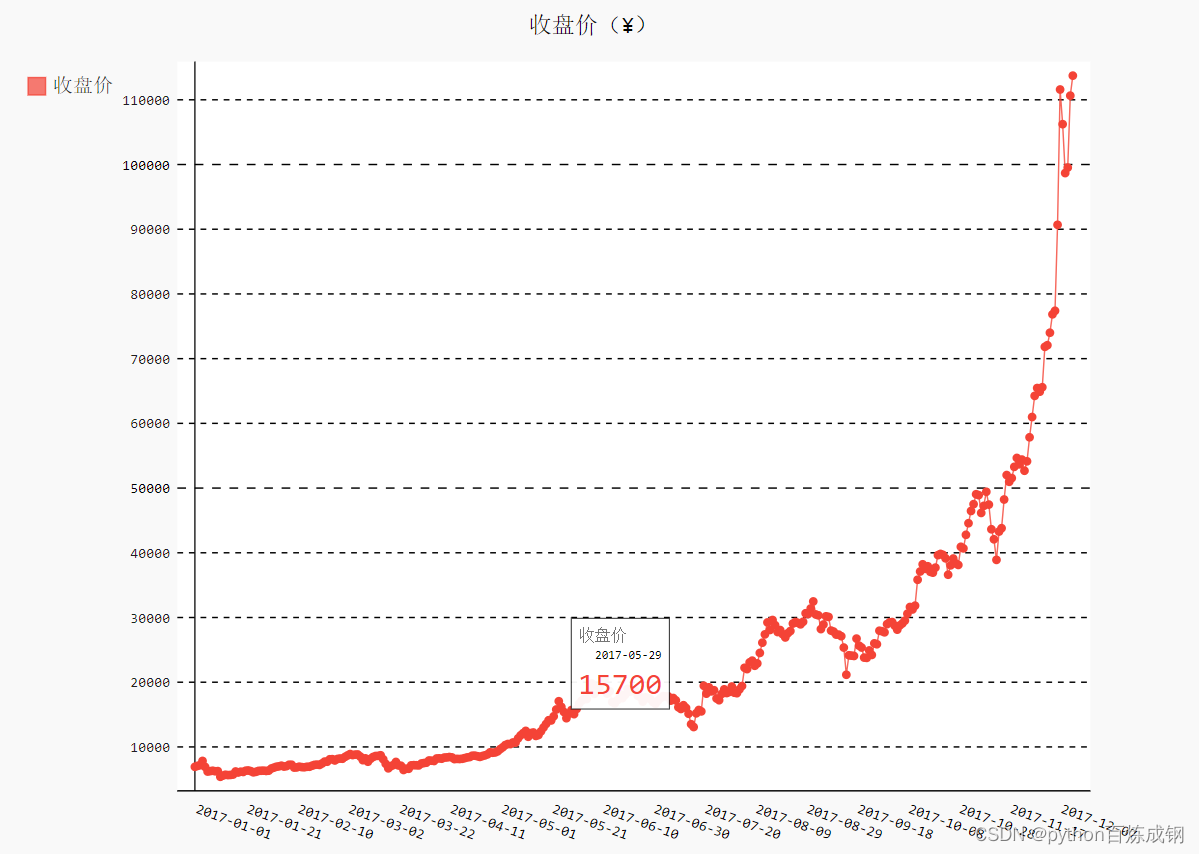

![PS Mac Photoshop 2024 for Mac[破]图像处理软件[解]PS 2024安装教程[版]](https://img-blog.csdnimg.cn/direct/f6dc210cea1442f696cd9a9a11de6019.png)

