对双色球数据探索
数据准备
爬取双色球的数据
# -*- coding: utf-8 -*-
import os
import os.path
import sys
reload(sys)
sys.setdefaultencoding("utf-8")  #开奖日期中的字符需要引入
import urllib2
from bs4 import BeautifulSoup# 创建/打开一个文件放数据
def  fetchLottery():if os.path.exists("lottery.csv"):os.remove("lottery.csv")f = open("lottery.csv", "a")for i in range(3,16):print("正在获取"+"{:0>2d}".format(i)+"年数据")url = "http://www.lecai.com/lottery/draw/list/50?type=range_date&start=20"+"{:0>2d}".format(i)+"-01-01&end=20"+"{:0>2d}".format(i)+"-12-31"page = urllib2.urlopen(url)                                 # 打开目标urlsoup = BeautifulSoup(page,"html.parser")# 格式化标签#print(soup.find_all(attrs={"class":"historylist"}))foundAllTbody = soup.findAll(attrs={"class":"balls"})foundDate = soup.findAll("tbody")[0]num = 1if(foundAllTbody):for foundBalls in foundAllTbody[0:]:    foundAllTr = foundBalls.findAll("em")if(foundAllTr):ballStr = ""for foundTd in foundAllTr[0:]:if(foundTd):ballStr += ","ballStr += foundTd.string#print(foundTd.string)  date = foundDate.findAll("td")[(num-1)*10+num].string   #开奖日期print type(date)f.write(date +','+ ballStr+'\n')print(foundDate.findAll("td")[(num-1)*10+num].string)num = num + 1    print "数据抓取完成"f.close()fetchLottery()
%matplotlib inline
import pandas as pd
from pandas import DataFramelottery=pd.read_csv('lottery.csv')
lottery.index=[date[:-9] for date in lottery.date]
lottery=lottery.drop(['date'],axis=1)
lottery.index.name='date'lottery.to_csv('lottery_change.csv')
lottery.head(10)| R1 | R2 | R3 | R4 | R5 | R6 | B | |
|---|---|---|---|---|---|---|---|
| date | |||||||
| 2003-12-28 | 18 | 19 | 21 | 26 | 27 | 33 | 16 |
| 2003-12-25 | 3 | 10 | 21 | 22 | 24 | 33 | 12 |
| 2003-12-21 | 2 | 3 | 4 | 5 | 24 | 28 | 13 |
| 2003-12-18 | 5 | 12 | 16 | 18 | 26 | 30 | 13 |
| 2003-12-14 | 1 | 4 | 11 | 12 | 19 | 27 | 14 |
| 2003-12-11 | 2 | 6 | 7 | 10 | 17 | 33 | 3 |
| 2003-12-07 | 1 | 3 | 14 | 18 | 26 | 28 | 1 |
| 2003-12-04 | 7 | 17 | 18 | 19 | 30 | 31 | 14 |
| 2003-11-30 | 1 | 2 | 14 | 26 | 29 | 30 | 7 |
| 2003-11-27 | 9 | 20 | 24 | 25 | 28 | 30 | 10 |
lottery.hist()
lottery.shape
(1899, 7)
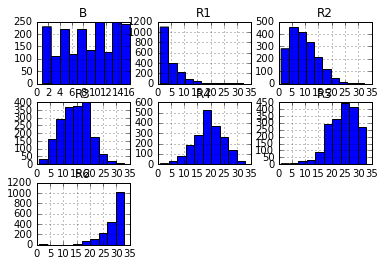
进行简单的数据探索,可以看书B{蓝色球}的分布让人很是蛋疼,然而R1-R6{红色球}的数据分布是傻子都能看的出来,R1一般比较小,R6一般分布在25-33之间。
lottery.ix[:,:'B'].sum(axis=1).hist()<matplotlib.axes._subplots.AxesSubplot at 0x114319e8>
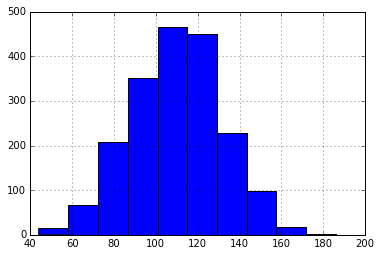
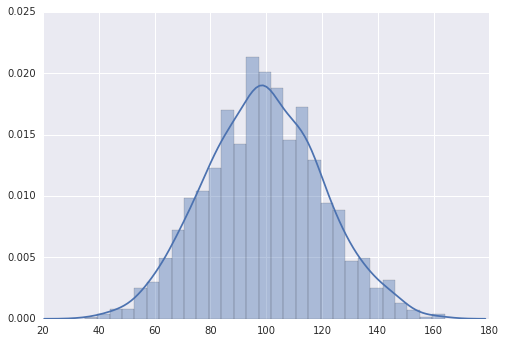
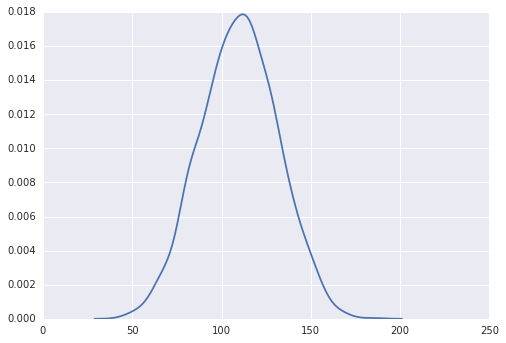
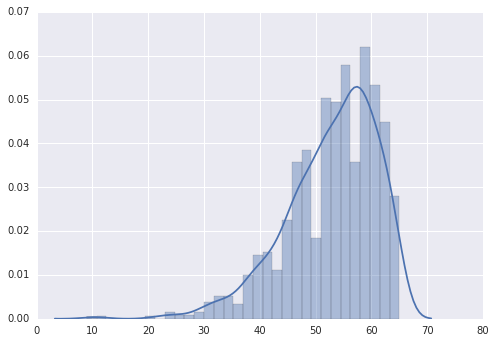
B的R1-R6之和的数据分布,看着貌似还是有点小规律,基本上分布在90-110之间。可是只又有什么卵用—-和下面随机选择的基本上算一致的(随机选择若是按照概率生成的话也许结果更有说服力)
import random
from pandas import DataFrame
seed=range(1,33)
random_select=[]
for i in range(1899):lotter=random.sample(seed,6)random_select.append(lotter)
sns.distplot(DataFrame(random_select).sum(axis=1))
import seaborn as sns
import matplotlib.pyplot as plt
import pandas as pd
sns.set_style('darkgrid')
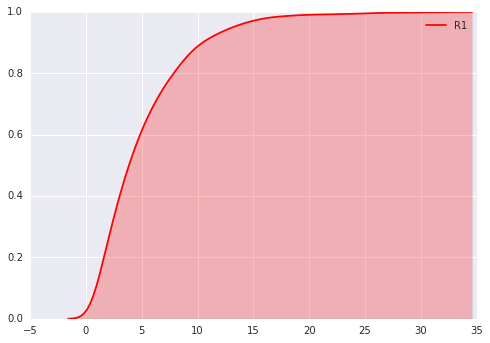
g=sns.pairplot(lottery)ax=sns.kdeplot(lottery.R1,shade=True,color='r',cumulative=True)
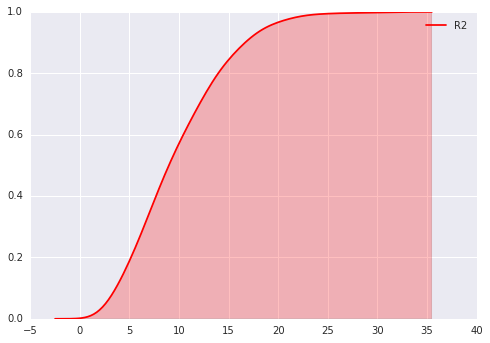
ax=sns.kdeplot(lottery.R2,shade=True,color='r',cumulative=True)这是R2的概率密度分布图
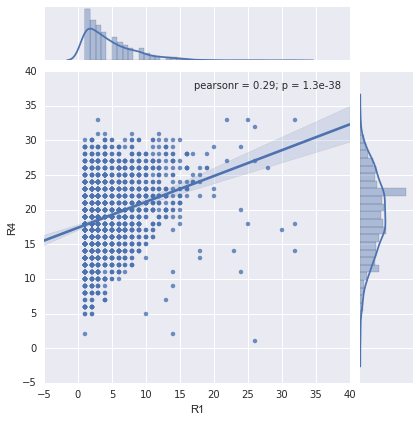
sns.jointplot('R1','R4',data=lottery,kind='reg')<seaborn.axisgrid.JointGrid at 0x2f0d2da0>
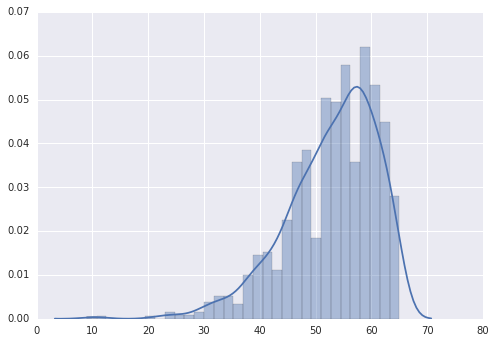
ax=sns.kdeplot(lottery.ix[:,:'B'].sum(axis=1))ax=sns.kdeplot(lottery.ix[:,-3:-1].sum(axis=1))ax = sns.distplot(lottery.ix[:,-3:-1].sum(axis=1))观察尾和
lottery_sort=pd.read_csv('lottery_change.csv',index_col=0,parse_dates=0)
roll_mean=pd.rolling_mean(lottery_sort,20).dropna()
import  matplotlib.pyplot as pltfor i in range(1,7):plt.subplot(230+i)a='R'+str(i)sns.distplot(roll_mean[a])
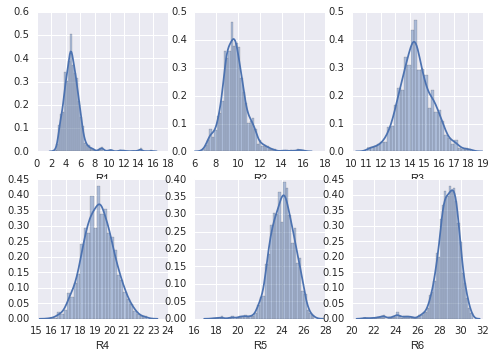
观察R1-R6的概率密度分布图
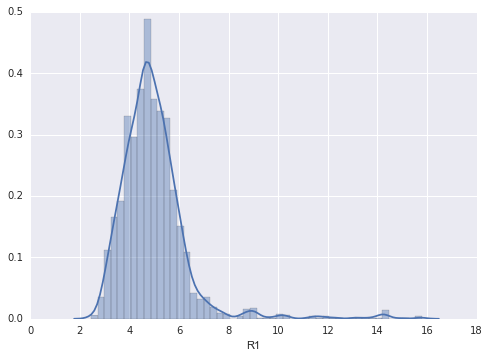
sns.distplot(roll_mean['R1'])<matplotlib.axes._subplots.AxesSubplot at 0x2bf19da0>
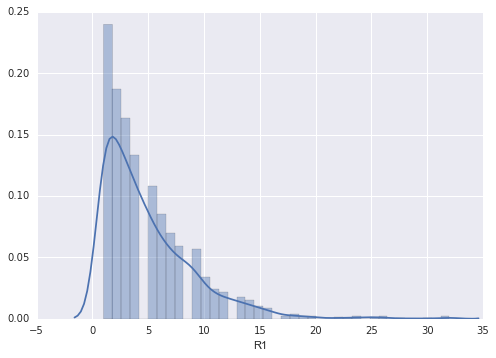
sns.distplot(lottery.R1)<matplotlib.axes._subplots.AxesSubplot at 0x3000f9e8>
import numpy as np
tim=np.zeros((1899,50))
lottery_sort['BL']=lottery_sort.B.values+33
lottery_sort=lottery_sort.drop('B',axis=1)
loc=lottery_sort.values
lottery_sort.head()| R1 | R2 | R3 | R4 | R5 | R6 | BL | |
|---|---|---|---|---|---|---|---|
| date | |||||||
| 2003-02-23 | 10 | 11 | 12 | 13 | 26 | 28 | 44 |
| 2003-02-27 | 4 | 9 | 19 | 20 | 21 | 26 | 45 |
| 2003-03-02 | 1 | 7 | 10 | 23 | 28 | 32 | 49 |
| 2003-03-06 | 4 | 6 | 7 | 10 | 13 | 25 | 36 |
| 2003-03-09 | 4 | 6 | 15 | 17 | 30 | 31 | 49 |
运用文本的分类的模式进行计算:
- 将矩阵转换成词袋模型 就是[1,3,6]转换成[1,0,1,0,0,1]的形式
- 计算每个feature出现的概率,或者设置窗口观察出现概率的变化
- 简单的差分或者也可以采用其他你认为好的方法,目前所做的只能增加你的机会
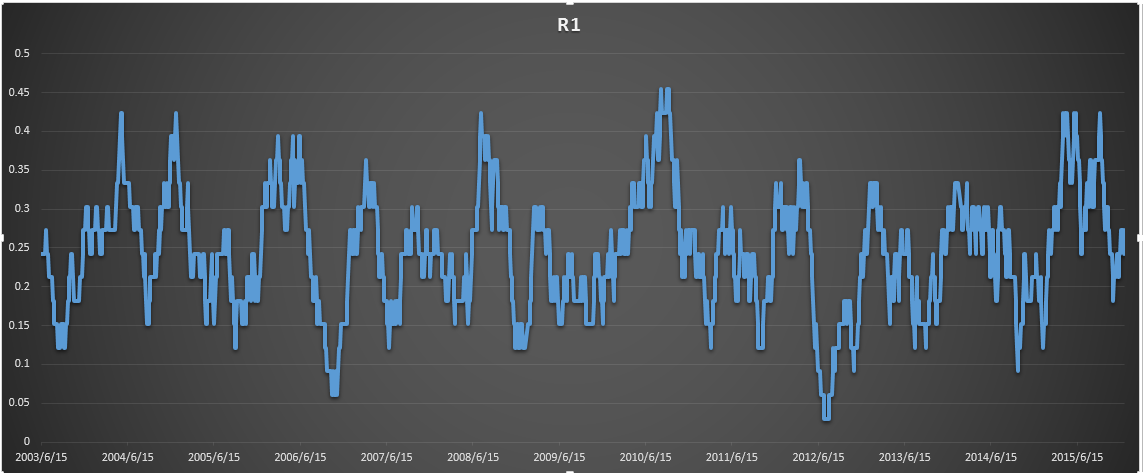
窗口为33 R1概率的变化率,你会发现有一定的规律,对啥号有一定的帮助。
for i in range(1899):tim[i,loc[i]]=1
from pandas import DataFrame
# sns.jointplot(np.arange(34),tim.sum(axis=0)/1899.0,kind='reg')
def prob(x):prom=x.sum()/float(x.shape[0])return prom
for window in range(10,12,2):print "Window=:",windowprobBR=DataFrame(pd.rolling_apply(tim,window,prob),index=lottery_sort.index).dropna().diff(1)choose_blue=[]for i in range(probBR.shape[0]):max6=probBR.ix[i,:33].argsort()[-6:].tolist()maxB=probBR.ix[i,33:].argmax()choose_blue.append(sorted(max6)+[maxB])# print choose_blueprob33=DataFrame(choose_blue,index=probBR.index,columns=['R1','R2','R3','R4','R5','R6','BL']).shift(1).dropna()eq=(lottery_sort - prob33).ix[:,:-1].dropna()eq_count=eq[eq==0].count(axis=1)cnt=0.0print eqfor i in eq[eq==0].count(axis=1):if i>4:cnt+=1.0print cnt/float(eq_count.shape[0])#     scoring=eq_count.sum()/eq_count.shape[0]
# print scoring| score | |
|---|---|
| window_size | |
| 10 | 0.389095 |
| 12 | 0.409115 |
| 14 | 0.401592 |
| 16 | 0.381306 |
| 18 | 0.408825 |
| 20 | 0.392762 |
| 22 | 0.400639 |
| 24 | 0.394667 |
| 26 | 0.389749 |
| 28 | 0.373597 |
| 30 | 0.405029 |
| 32 | 0.395822 |
| 34 | 0.394638 |
| 36 | 0.395062 |
| 38 | 0.397098 |
| 40 | 0.401291 |
| 42 | 0.396338 |
| 44 | 0.400000 |
| 46 | 0.384242 |
| 48 | 0.416532 |
| 50 | 0.395890 |
| 52 | 0.419058 |
| 54 | 0.408672 |
| 56 | 0.383071 |
| 58 | 0.405215 |
| 60 | 0.418162 |
| 62 | 0.384322 |
| 64 | 0.395640 |
| 66 | 0.395526 |
| 68 | 0.401966 |
| 70 | 0.412794 |
| 72 | 0.399562 |
| 74 | 0.398356 |
| 76 | 0.419089 |
| 78 | 0.388797 |
| 80 | 0.391974 |
| 82 | 0.389653 |
| 84 | 0.403857 |
| 86 | 0.396580 |
| 88 | 0.419658 |
| 90 | 0.364290 |
| 92 | 0.397344 |
| 94 | 0.396676 |
| 96 | 0.382141 |
| 98 | 0.408662 |
lottery_sort.shift(1)| R1 | R2 | R3 | R4 | R5 | R6 | BL | |
|---|---|---|---|---|---|---|---|
| date | |||||||
| 2003-02-23 | NaN | NaN | NaN | NaN | NaN | NaN | NaN |
| 2003-02-27 | 10 | 11 | 12 | 13 | 26 | 28 | 44 |
| 2003-03-02 | 4 | 9 | 19 | 20 | 21 | 26 | 45 |
| 2003-03-06 | 1 | 7 | 10 | 23 | 28 | 32 | 49 |
| 2003-03-09 | 4 | 6 | 7 | 10 | 13 | 25 | 36 |
| 2003-03-13 | 4 | 6 | 15 | 17 | 30 | 31 | 49 |
| 2003-03-16 | 1 | 3 | 10 | 21 | 26 | 27 | 39 |
| 2003-03-20 | 1 | 9 | 19 | 21 | 23 | 26 | 40 |
| 2003-03-23 | 5 | 8 | 9 | 14 | 17 | 23 | 41 |
| 2003-03-27 | 5 | 9 | 18 | 20 | 22 | 30 | 42 |
| 2003-03-30 | 1 | 2 | 8 | 13 | 17 | 24 | 46 |
| 2003-04-03 | 4 | 5 | 11 | 12 | 30 | 32 | 48 |
| 2003-04-06 | 2 | 12 | 16 | 17 | 27 | 30 | 45 |
| 2003-04-10 | 8 | 13 | 17 | 21 | 23 | 32 | 45 |
| 2003-04-13 | 3 | 5 | 7 | 8 | 21 | 31 | 35 |
| 2003-04-17 | 4 | 11 | 19 | 25 | 26 | 32 | 46 |
| 2003-04-20 | 11 | 17 | 28 | 30 | 31 | 33 | 39 |
| 2003-04-24 | 5 | 8 | 18 | 23 | 25 | 31 | 39 |
| 2003-04-27 | 5 | 16 | 19 | 20 | 25 | 28 | 46 |
| 2003-05-01 | 4 | 8 | 12 | 13 | 16 | 33 | 42 |
| 2003-05-04 | 7 | 10 | 25 | 26 | 27 | 32 | 37 |
| 2003-05-08 | 14 | 15 | 18 | 25 | 26 | 30 | 34 |
| 2003-05-11 | 2 | 7 | 11 | 12 | 14 | 32 | 41 |
| 2003-05-15 | 1 | 10 | 20 | 22 | 26 | 31 | 35 |
| 2003-05-18 | 2 | 7 | 15 | 17 | 22 | 30 | 47 |
| 2003-05-22 | 1 | 5 | 11 | 13 | 14 | 27 | 45 |
| 2003-05-25 | 8 | 13 | 15 | 26 | 29 | 31 | 49 |
| 2003-05-29 | 1 | 11 | 14 | 17 | 27 | 28 | 48 |
| 2003-06-01 | 6 | 13 | 16 | 20 | 28 | 32 | 40 |
| 2003-06-05 | 2 | 7 | 15 | 26 | 29 | 32 | 43 |
| … | … | … | … | … | … | … | … |
| 2015-10-25 | 2 | 3 | 5 | 12 | 18 | 27 | 34 |
| 2015-10-27 | 5 | 13 | 22 | 27 | 30 | 33 | 43 |
| 2015-10-29 | 10 | 11 | 15 | 20 | 23 | 29 | 45 |
| 2015-11-01 | 7 | 10 | 19 | 22 | 27 | 33 | 39 |
| 2015-11-03 | 1 | 3 | 8 | 11 | 22 | 28 | 39 |
| 2015-11-05 | 5 | 8 | 11 | 16 | 18 | 27 | 37 |
| 2015-11-08 | 6 | 14 | 15 | 16 | 17 | 22 | 43 |
| 2015-11-10 | 10 | 12 | 13 | 19 | 22 | 26 | 36 |
| 2015-11-12 | 3 | 5 | 11 | 28 | 30 | 33 | 34 |
| 2015-11-15 | 2 | 3 | 13 | 20 | 22 | 24 | 48 |
| 2015-11-17 | 2 | 5 | 14 | 19 | 27 | 31 | 37 |
| 2015-11-19 | 1 | 12 | 14 | 18 | 26 | 32 | 40 |
| 2015-11-22 | 2 | 5 | 12 | 23 | 28 | 29 | 34 |
| 2015-11-24 | 14 | 22 | 23 | 27 | 28 | 31 | 45 |
| 2015-11-26 | 1 | 2 | 8 | 16 | 19 | 24 | 44 |
| 2015-11-29 | 1 | 10 | 13 | 18 | 25 | 27 | 42 |
| 2015-12-01 | 6 | 20 | 28 | 29 | 30 | 31 | 45 |
| 2015-12-03 | 3 | 8 | 19 | 25 | 27 | 28 | 35 |
| 2015-12-06 | 13 | 17 | 19 | 20 | 22 | 25 | 44 |
| 2015-12-08 | 13 | 15 | 19 | 20 | 21 | 32 | 37 |
| 2015-12-10 | 1 | 4 | 7 | 15 | 28 | 32 | 49 |
| 2015-12-13 | 7 | 8 | 15 | 19 | 20 | 24 | 46 |
| 2015-12-15 | 16 | 17 | 21 | 28 | 30 | 32 | 48 |
| 2015-12-17 | 8 | 9 | 16 | 23 | 24 | 30 | 38 |
| 2015-12-20 | 9 | 13 | 14 | 22 | 26 | 27 | 40 |
| 2015-12-22 | 9 | 10 | 20 | 21 | 22 | 33 | 42 |
| 2015-12-24 | 1 | 3 | 8 | 11 | 29 | 31 | 46 |
| 2015-12-27 | 5 | 6 | 8 | 23 | 31 | 32 | 44 |
| 2015-12-29 | 11 | 18 | 19 | 21 | 29 | 32 | 45 |
| 2015-12-31 | 8 | 11 | 15 | 22 | 27 | 29 | 36 |
1899 rows × 7 columns
import itertools
list(itertools.permutations([1,2,3,4],2))   #排列
list(itertools.combinations([1,2,3,4],2))    #组合
总结
只是做了一下简单的数据探索,通过数据来看可预测性不强,但是可以通过转换的思路去理解数据(以窗口33为例):
- 建立窗口,通过观察前后窗口概率的变化(差分)可以得出某个数字出现的概率的变化趋势(分析过中国的股市,变化的规律跟彩票差不多。。。。。不过有些基本面的信息做支撑)
- 可以贝叶斯的思想模型,从第一部得出窗口概率,对33个数据的组合中找出最有可能出现的组合(双色球的组选模式)
- 马尔科夫模型大部分是用在文本分析上面,可以用于彩票的预测
- 神经网络模型入度6出度为6
(11选5,10分钟开一次奖能更好的验证方法)
以上只是谈疼的思考,若有不当之处,多批评。。。
