数据加载
①单细胞学习-数据读取、降维和分群_subset函数单细胞群-CSDN博客‘
#2024年6月20日 单细胞组间差异分析升级#
rm(list = ls())
library(Seurat)#数据加载(在第一步已经处理好的数据)
load("scedata1.RData")#这里是经过质控和降维后的单细胞数据
table(scedata$orig.ident)#查看样本组别及细胞数
table(Idents(scedata))#查看各种类型细胞数目
#prop.table(table(Idents(scedata)))
table(Idents(scedata), scedata$orig.ident)#每个样本不同类型细胞数据UMAPPlot(scedata,label = T)##UMAP降维展示
分组可视化
#添加样本分组
table(scedata$orig.ident)#查看样本组别及细胞数
#BM1  BM2  BM3  GM1  GM2  GM3
#2754  747 2158 1754 1528 1983
scedata$group <- ifelse(scedata$orig.ident %in% c("BM1","BM2","BM3"), "BM","GM")
#分组可视化
DimPlot(scedata, reduction = "umap", group.by = "group")

组间差异基因
#计算每个亚群细胞数量和比例#
cell_counts <-  table(Idents(scedata))
cell.all <- cbind(cell_counts = cell_counts, cell_Freq = round(prop.table(cell_counts)*100,2))#添加细胞比例计算,保留2位小数
#各组中每种细胞的数量和比例
cell.num.group <- table(Idents(scedata), scedata$group)
cell.freq.group <- round(prop.table(cell.num.group, margin = 2) *100,2)
cell.all <-  cbind(cell.all,cell.num.group,cell.freq.group)
cell.all <-  cell.all[,c(1,3,4,2,5,6)]
colnames(cell.all) <-  paste(rep(c("all","BM","GM"),times = 2),rep(c("count","freq"),each = 3),sep = "_")
cell.alltable(Idents(scedata))#查看各种注释细胞群
#计算组间的差异(细胞比例分析发现Endothelial存在组间差异)
library(metap)
sub.markers <- FindConservedMarkers(scedata, ident.1 = "Endothelial", #前面注释的细胞类型grouping.var = "group",min.pct = 0.25, logfc.threshold = 0.25,verbose = F)
head(sub.markers)#该细胞类型在组间的差异
#选择感兴趣的基因
#gene <- rownames(sub.markers)
markers.to.plot <-  c("COL1A1","COL3A1","LUM","COL1A2","DCN","C1S","COL6A1","COL6A2") #一组感兴趣的基因
p1 <- DotPlot(scedata, features = markers.to.plot, cols = c("blue", "red"), dot.scale = 8, split.by = "group") +RotatedAxis()
p1
dev.off()
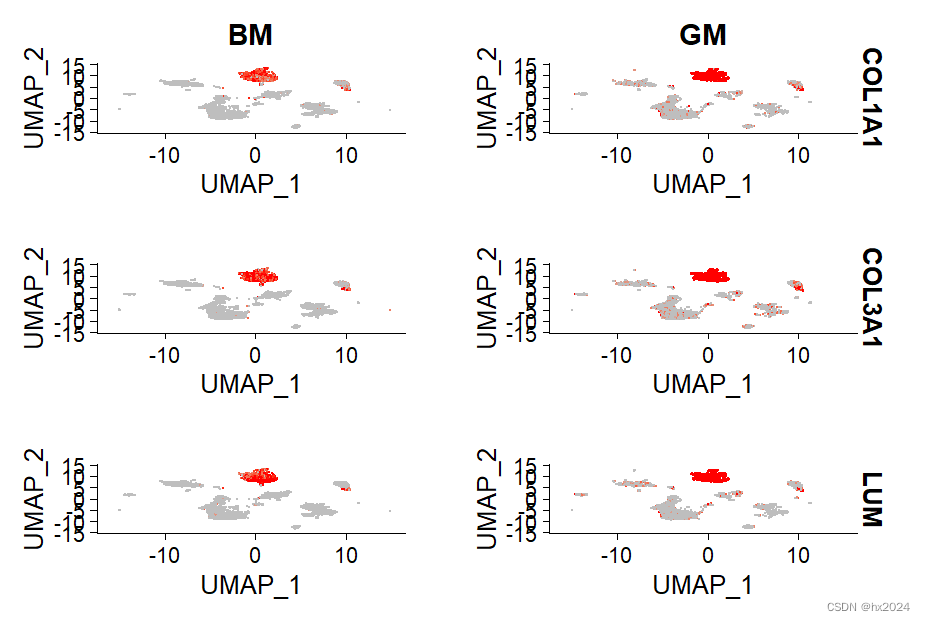
p2 <-FeaturePlot(scedata, features = c("COL1A1","COL3A1","LUM"), split.by = "group", max.cutoff = 3, cols = c("grey","red"), reduction = "umap")
p2
dev.off()