PyG (PyTorch Geometric) 是建立在 PyTorch 基础上的一个库,用于轻松编写和训练图形神经网络 (GNN),适用于与结构化数据相关的各种应用。官方文档
Install PyG
PyG适用于python3.8-3.12
一般使用场景:pip install torch_geometric 或conda install pyg -c pyg
Get Started
PyG 具有以下主要功能:
- Data Handling of Graphs
- Common Benchmark Datasets
- Mini-batches
- Data Transforms
- Learning Methods on Graphs
- Exercises
Data Handling of Graphs
PyG 中的单个图由 torch_geometric.data.Data 的一个实例描述,默认情况下该实例拥有以下属性:
- data.x: Node feature matrix with shape [num_nodes, num_node_features]
- data.edge_index: Graph connectivity in COO format with shape [2, num_edges] and type torch.long
- data.edge_attr: Edge feature matrix with shape [num_edges, num_edge_features]
- data.y: Target to train against (may have arbitrary shape), e.g., node-level targets of shape [num_nodes, *] or graph-level targets of shape [1, *]
- data.pos: Node position matrix with shape [num_nodes, num_dimensions]
Colab Notebooks and Video Tutorials
官方文档
Pytroch Geometric Tutorials
Tutorials 1
理解一个节点出发的计算图,理解多次计算图后可能节点信息就包含整个图数据信息了,反而没有用。
对应whl地址
安装torch版本对应的pyg,如下所示:
import os
import torch
os.environ['TORCH'] = torch.__version__
print(torch.__version__)!pip install -q torch-scatter -f https://data.pyg.org/whl/torch-${TORCH}.html
!pip install -q torch-sparse -f https://data.pyg.org/whl/torch-${TORCH}.html
!pip install -q git+https://github.com/pyg-team/pytorch_geometric.git
可视化网络的函数实现
# 可视化函数
%matplotlib inline
import torch
import networkx as nx
import matplotlib.pyplot as plt# visualization function for NX graph or Pytorch tensor
def visualize(h, color, epoch=None, loss=None):plt.figure(figsize=(7,7))plt.xticks([])plt.yticks([])if torch.is_tensor(h):# 可视化神经网络运行中间结果h = h.detach().cpu().numpy()plt.scatter(h[:, 0], h[:, 1], s=140, c=color, cmap="Set2")if epoch is not None and loss is not None:plt.xlabel(f'Epoch:{epoch}, Loss:{loss.item():.4f}', fontsize=16)else:nx.draw_networkx(G, pos=nx.spring_layout(G, seed=42), with_labels=False, node_color=color, cmap="Set2")plt.show()
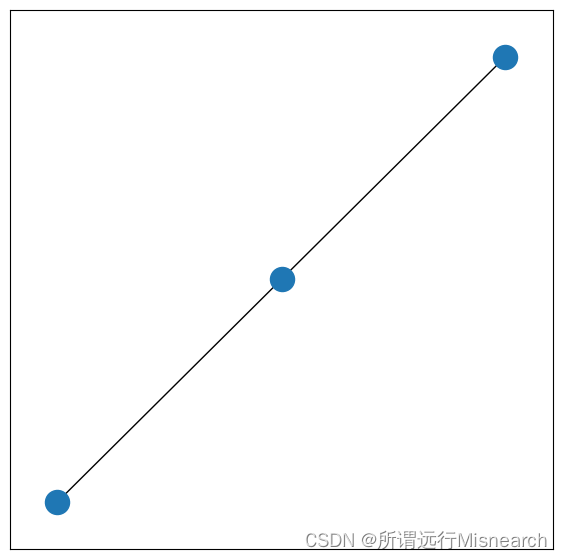
例如:
from torch_geometric.utils import to_networkxG = to_networkx(data, to_undirected=True)
visualize(G, color=data.y)
如图所示:
参考:
PyTorch Geometric (PyG) 入门教程


