Title
题目
A denoising diffusion probabilistic model for metal artifact reduction in CT
CT金属伪影去除的去噪扩散概率模型
01
文献速递介绍
CT图像中的金属伪影是在CT扫描视野内存在金属物体(如牙科填充物、骨科假体、支架、手术器械等)时出现的视觉失真。这些失真可能会影响临床检查的诊断信心以及放射治疗计划的准确性。
金属伪影在CT图像中表现为从金属物体发出的明暗带和更细的条纹。这些伪影的主要原因是光子饥饿,即由于X射线通过金属物体时的高衰减,导致只有不足数量的光子到达探测器,从而产生严重的噪声条纹。此外,当X射线被金属物体强烈衰减时,束硬化和散射辐射的影响会加剧,导致金属物体之间出现暗带。部分容积效应和混叠也被认为是金属伪影形成的机制。
为提高CT扫描的图像质量,已经提出了几种金属伪影去除(MAR)方法。之前的研究主要集中在纠正引起金属伪影的物理效应,包括噪声、散射和束硬化。然而,当存在严重伪影时,这些方法可能效果不佳。迭代重建MAR方法也被提出:其优势在于可以统计性地降低或完全忽略受损测量数据,并且可以结合非理想物理效应的前向模型,从而避免伪影的产生。此外,基于插值的技术被广泛用于MAR,这些技术将正弦图中受金属污染的部分视为缺失信息,并使用插值方案进行替换。
Abstract
摘要
金属物体的存在会导致CT投影测量数据损坏,从而在重建的CT图像中产生金属伪影。人工智能(AI)有望提供更好的解决方案来估计缺失的正弦图数据,以减少金属伪影(MAR),如之前在卷积神经网络(CNNs)和生成对抗网络(GANs)中所示。最近,去噪扩散概率模型(DDPM)在图像生成任务中表现出极大的潜力,可能优于GANs。在本研究中,提出了一种基于DDPM的方法,用于填补缺失的正弦图数据,以改进MAR。该模型在训练过程中不需要金属物体的信息,这可能增强其在不同类型金属植入物上的泛化能力,相较于依赖条件训练的方法。对所提出的技术进行了性能评估,并与最先进的归一化MAR(NMAR)方法以及基于CNN和GAN的MAR方法进行了比较。基于DDPM的方法提供了显著更高的结构相似性指数(SSIM)和峰值信噪比(PSNR),与NMAR(SSIM:p < 10-26;PSNR:p < 10-21),CNN(SSIM:p < 10-25;PSNR:p < 10-9)和GAN(SSIM:p < 10-6;PSNR:p < 0.05)方法相比。基于DDPM的MAR技术进一步基于临床相关图像质量指标对临床CT图像中虚拟引入的金属物体和金属伪影进行了评估,显示出相对于其他三种模型的优越质量。总体而言,基于AI的技术相较于非AI的NMAR方法显示出改进的MAR性能。所提出的方法在提高MAR效果方面显示出前景,从而提高了CT的诊断准确性。
Method
方法
A. Data generation
Training data are generated by performing highly realistic CT simulations of real patient images with and without metal objects as well as simulations of metal objects only. The metalonly sinograms are used to mask the data in the shadow of the metal objects (i.e., the metal trace) as an ideal input to the MAR methods, as illustrated in Figure 1. We previously validated that our recently developed realistic CT physics models in the CatSim CT simulator [23], [24] result in highly realistic CT simulations [25] as well as realistic metal artifacts. We here use a nominal CT geometry with source-to-iso-distance 540 mm, source-to-detector distance 950 mm, 1.0 mm x 1.1 mm detector cells, detector quarter offset, 120 kVp tube voltage, 200 mA tube current, 2 detector rows, 888 detector columns, 984 views, a large bowtie filter, and realistic quantum noise, electronic noise and beam hardening.
A. 数据生成
训练数据通过对真实患者图像进行高逼真度的CT模拟生成,这些图像包括有金属物体和没有金属物体的情况,以及仅有金属物体的模拟。金属物体的正弦图用于在金属物体的阴影中遮蔽数据(即金属痕迹),作为MAR方法的理想输入,如图1所示。我们之前已经验证,我们最近在CatSim CT模拟器中开发的逼真CT物理模型可以产生高度逼真的CT模拟,以及逼真的金属伪影。在此,我们使用了名义上的CT几何参数,源到等距距离为540毫米,源到探测器距离为950毫米,探测器单元为1.0毫米x 1.1毫米,探测器四分之一偏移,管电压为120 kVp,管电流为200 mA,2排探测器,888列探测器,984视图,大楔形滤波器,以及逼真的量子噪声、电子噪声和束硬化。
Conclusion
结论
In this study, a denoising diffusion probabilistic model (DDPM) was developed to estimate missing sinogram data for CT MAR. The model is unconditionally trained without using information on the metal corrupted data, which can potentially provideenhanced generalization capabilities across various types of metal objects. The DDPM-MAR was compared to a state-ofthe-art analytical method (NMAR) and two other AI methods (PUnet and GAN). The results were evaluated using standard computer vision metrics in a test dataset of 200 images. In addition, the methods were evaluated using a series of clinically relevant performance metrics in four clinical CT scans with realistic metal objects and artifacts. In general, all AI methods outperformed the analytical NMAR method. Furthermore, the DDPM approach outperformed the PUnet and GAN approaches. The DDPM model was capable of effectively reducing metal artifacts in all test cases and following all different performance metrics. The proposed methodology enhances the state of the art in MAR, showing promise in improving the diagnostic accuracy of CT scans.
在本研究中,开发了一种去噪扩散概率模型(DDPM)来估计CT金属伪影去除(MAR)中的缺失正弦图数据。该模型在训练过程中不使用金属污染数据的信息,从而可能在各种类型的金属物体中提供增强的泛化能力。DDPM-MAR与一种最先进的分析方法(NMAR)和其他两种AI方法(PUnet和GAN)进行了比较。使用200张图像的测试数据集,通过标准计算机视觉指标对结果进行了评估。此外,这些方法在四个带有逼真金属物体和伪影的临床CT扫描中,通过一系列临床相关的性能指标进行了评估。总体而言,所有AI方法都优于分析方法NMAR。此外,DDPM方法优于PUnet和GAN方法。DDPM模型能够在所有测试案例中以及不同的性能指标下有效地减少金属伪影。所提出的方法改进了MAR的最先进技术,在提高CT扫描的诊断准确性方面显示出前景。
Results
结果
A. Qualitative performance assessment
Figure 4 shows the performance of the different MAR techniques in an abdominal CT scan of the test dataset with a single simulated metal object. Figure 4-A illustrates an example of a CT image resulting from a sinogram without metal object. The respective simulated metal object, indicated by a yellow circle, is overlaid with the maximum grayscale value. Figure 4-B shows the respective metal corrupted image. A realistic metal simulation was carried out to visualize the metal artifacts. Figures 4-C-F illustrate the MAR-corrected images resulting from the NMAR, PUnet, GAN and DDPM correction methods, respectively. Figures 4-G-L demonstrate magnified versions of Figures 4-C-F, in a region around the virtual metal trace. The location of the magnified region corresponds to the greendashed rectangle, overlaid on Figure 4-A. The red, orange and green colored arrows correspond to high, intermediate and lowdegree of metal artifact presence. Difference images illustratingthe intensity of residual metal artifacts after applying each MAR technique are provided in the supplemental Figure S1. It)can be observed that the AI methods generally outperform NMAR, while the DDPM outperforms PUnet and GAN, demonstrating relatively lower intensity of residual metal artifacts.
A. 定性性能评估
图4显示了在测试数据集中单个模拟金属物体的腹部CT扫描中,不同MAR技术的表现。图4-A展示了一个没有金属物体的正弦图生成的CT图像示例。相应的模拟金属物体(用黄色圆圈标示)被叠加在最大灰度值上。图4-B显示了相应的金属污染图像,进行了一次逼真的金属模拟以可视化金属伪影。图4-C至4-F分别展示了通过NMAR、PUnet、GAN和DDPM修正方法生成的MAR修正图像。图4-G至4-L展示了图4-C至4-F中虚拟金属痕迹周围区域的放大版本。放大区域的位置对应于图4-A中绿色虚线矩形。红色、橙色和绿色箭头分别对应高、中、低程度的金属伪影。补充图S1中提供了应用每种MAR技术后残余金属伪影强度的差异图像。
可以观察到,AI方法总体上优于NMAR,而DDPM优于PUnet和GAN,显示出相对较低的残余金属伪影强度。
Figure
图
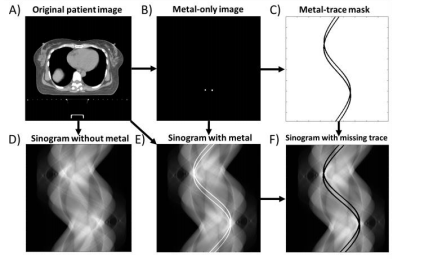
Figure 1: Methodology for dataset generation and sinogram corruption using traces of generated metal objects.
图1:数据集生成方法和使用生成的金属物体痕迹进行正弦图破坏的方法。

Figure 2: Training process of a denoising diffusion probabilistic model. A ground truth sinogram, SGT,0, is subjected to noising at multiple noising steps, t, through the forward diffusion process, q(), until it is converted to white noise, SGT,T. The reverse diffusion process, pθ, starts from SGT,Τ, and removes noise at multiple time steps, until it is restores the original sinogram. The reverse diffusion is modelled by a U-net which predicts the noise distribution at each step.
图2:去噪扩散概率模型的训练过程。一个真实的正弦图 SGT,0S{\text{GT},0}SGT,0 在多个加噪步骤 ttt 中通过前向扩散过程 q()q()q() 逐渐被加噪,直到其变成白噪声 SGT,TS{\text{GT},T}SGT,T。反向扩散过程 pθp{\theta}pθ 从 SGT,TS{\text{GT},T}SGT,T 开始,在多个时间步长中逐步去噪,直到恢复原始正弦图。反向扩散过程通过一个U-net模型来模拟,该模型在每一步预测噪声分布。
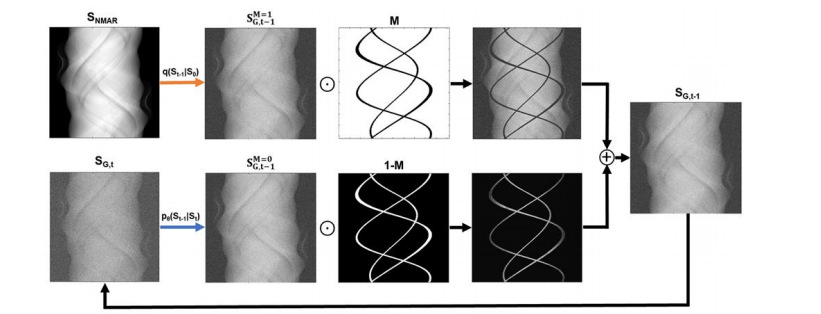
Figure 3: Inference scheme for sinogram inpainting based on a trained DDPM. At each diffusion step, t, a generated sinogram, SG,t is formed. The uncorrupted pixels of, SG,t, are sampled directly from the input, by adding noise through the forward diffusion process. The pixels corresponding to corrupted regions, are sampled by running the reverse diffusion process.
图3:基于已训练的DDPM的正弦图修复推理方案。在每个扩散步骤 ttt,生成的正弦图 SG,tS{G,t}SG,t 被形成。SG,tS{G,t}SG,t 的未损坏像素直接从输入中采样,通过前向扩散过程添加噪声。对应于损坏区域的像素通过运行反向扩散过程来采样。
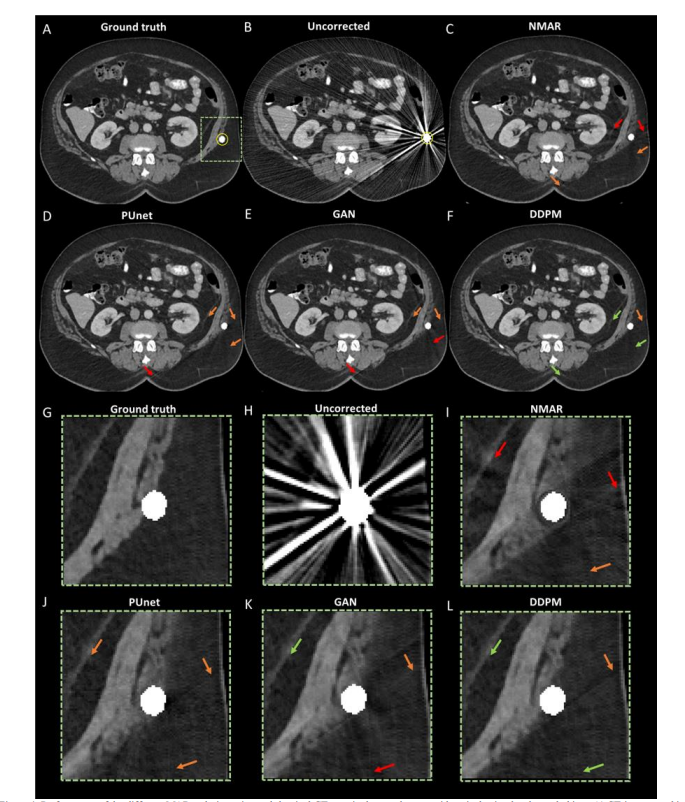
Figure 4: Performance of the different MAR techniques in an abdominal CT scan in the test dataset, with a single simulated metal object. A) CT image resulting from a ground truth sinogram. The respective simulated metal object is overlaid (inside yellow circle). B) Metal corrupted image. C-F) MAR corrected images resulting from the NMAR, PUnet, GAN and DDPM correction methods, respectively. G-L) Magnified regions of the ground truth, uncorrected, NMAR, PUnet, GAN and DDPM corrected images. The location of the magnified regions corresponds to the green rectangle, overlaid on Figure 4-A, with the virtual metal trace in the field of view. The red, orange and green colored arrows correspond to high, intermediate and low degree of metal artifact presence. All images are displayed with a window level of 0 and width of 400 HU
图4:在测试数据集中单个模拟金属物体的腹部CT扫描中,不同MAR技术的表现。A) 由真实正弦图生成的CT图像。相应的模拟金属物体被叠加(黄色圆圈内)。B) 金属污染图像。C-F) 分别由NMAR、PUnet、GAN和DDPM修正方法生成的MAR修正图像。G-L) 真实图像、未修正图像、NMAR、PUnet、GAN和DDPM修正图像的放大区域。放大区域的位置对应于图4-A上叠加的绿色矩形,视野内有虚拟金属痕迹。红色、橙色和绿色箭头分别对应高、中、低程度的金属伪影。所有图像均以窗口水平0和宽度400 HU显示。
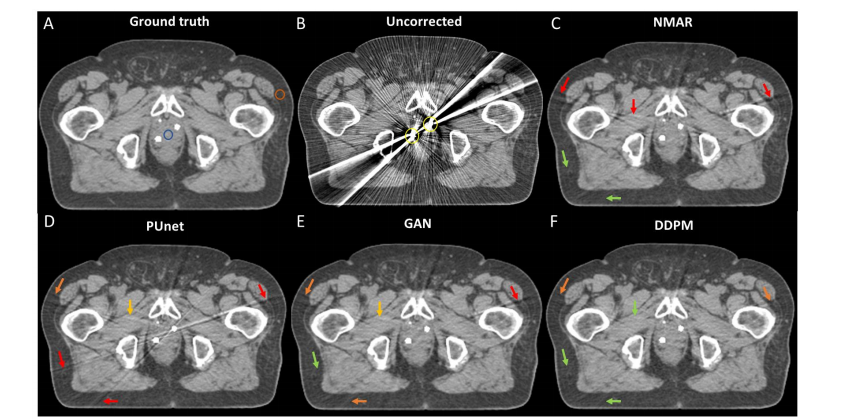
Figure 5: Performance of MAR techniques in a clinical CT of the pelvis with two virtually placed gold marker implants in the prostate (Patient 1). The blue and orange rings overlaid in section A) denote the ROIs in which the CTN performance metric was evaluated. For arrow description see Figure 4.
图5:在患者1的临床骨盆CT中,带有两个虚拟放置在前列腺中的金属标记植入物的MAR技术性能。A部分叠加的蓝色和橙色环表示评估CTN性能指标的感兴趣区域(ROI)。箭头说明见图4。
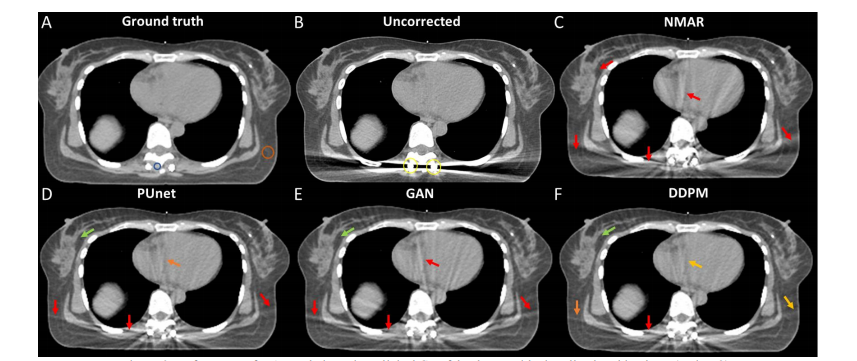
Figure 6: Performance of MAR techniques in a clinical CT of the thorax with virtually placed implants (Patient 2)
图6:在患者2的临床胸部CT中,带有虚拟放置的植入物的MAR技术性能。
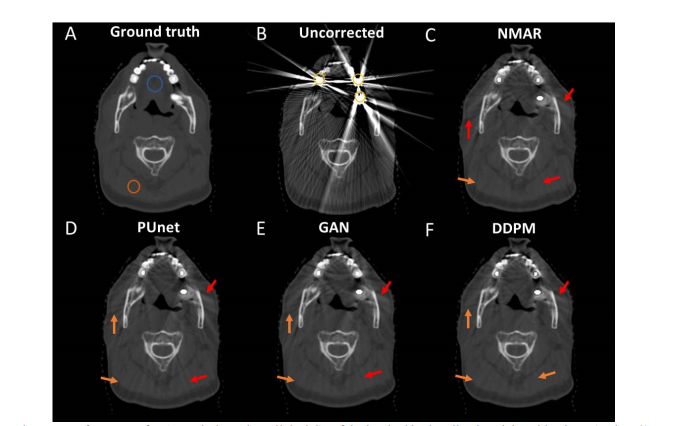
Figure 7: Performance of MAR techniques in a clinical CT of the head with virtually placed dental implants (Patient 3).
图7:在患者3的临床头部CT中,带有虚拟放置的牙科植入物的MAR技术性能。
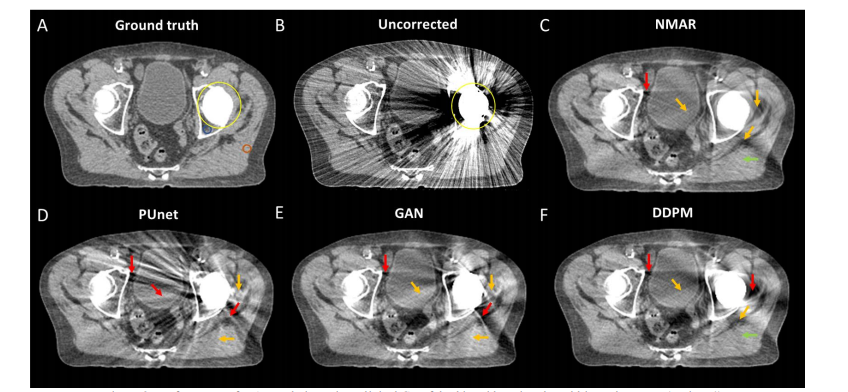
Figure 8: Performance of MAR techniques in a clinical CT of the hip with a virtual total hip replacement (Patient 4).
图8:在患者4的临床髋部CT中,带有虚拟全髋关节置换的MAR技术性能。
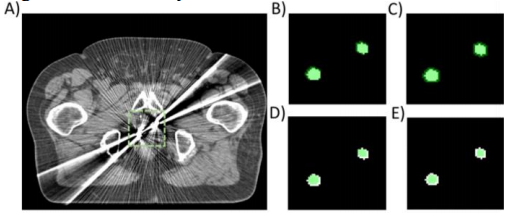
Figure 9: A) Clinical CT of the pelvis with two virtually placed gold marker implants in the prostate. B-E) Metal segmentation masks with ratios of segmented area to actual metal trace area equal to 1.4, 1.8, 0.7 and 0.5, respectively. The segmentation masks are overlaid in green color on top of a binary mask depicting the ground truth metal trace geometry.
图9:A) 临床骨盆CT,其中前列腺中有两个虚拟放置的金属标记植入物。B-E) 金属分割掩膜,其分割区域与实际金属痕迹区域的比值分别为1.4、1.8、0.7和0.5。分割掩膜以绿色叠加在表示真实金属痕迹几何形状的二值掩膜上。
Table
表

TABLE I – Mean and standard deviation of performance metrics
表 I – 性能指标的均值和标准差
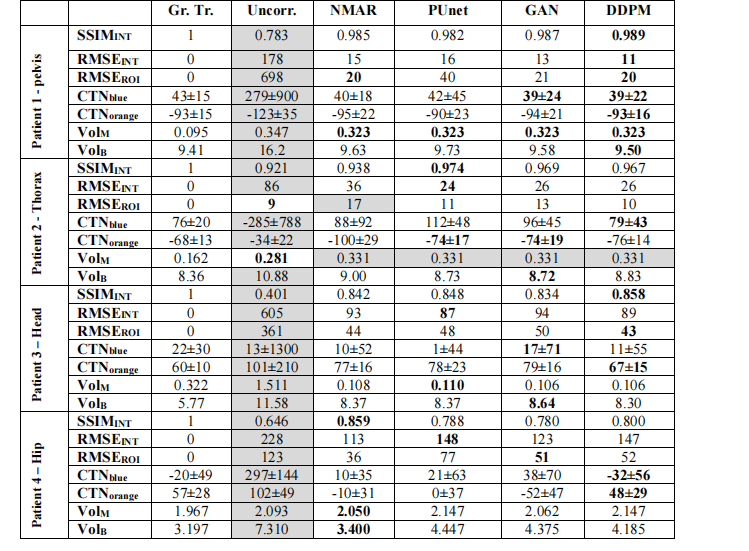
TABLE II – Summary of clinically relevant performance metrics in the clinical dataset with realistic metal object simulation. The best performing results for each metric are bolded. The worst performing result for each metric are shaded in gray.
表 II – 在临床数据集中使用逼真金属物体模拟的临床相关性能指标总结。每个指标中表现最好的结果用粗体表示。每个指标中表现最差的结果用灰色阴影表示。

Table III – MAR performance metrics for different metal mask segmentations
表 III – 不同金属掩膜分割的MAR性能指标


