提到R语言,总会想到它强大的绘图包ggplot2,甚至于其他语言中也有它的痕迹(例如,python中的matplotlib模块就有ggplot样式)。以下,总结了一些日常绘图中常用的命令。
目录
- 一、基本绘图
- 二、精雕细琢
- (1) 添加标题、横纵轴标签
- (2) 图片标题字体、大小、样式设置
- (3) 坐标轴标题及标签字体、大小及样式设置
- (4) 颜色设置
- (5) 图例样式设置
- (6) 多图汇总
- 三、ggplot2中的数据变换
一、基本绘图
ggplot2绘图是逐步叠加式的,由+号进行连接,每个函数控制着自己的部分。以下将以lattice包下的singer数据集为例进行说明,其共包含两个变量身高(height)和音域(voice.part)
I.绘制直方图
data(singer,package="lattice")
library(ggplot2)
ggplot(data=singer,aes(x=height))+geom_hist()
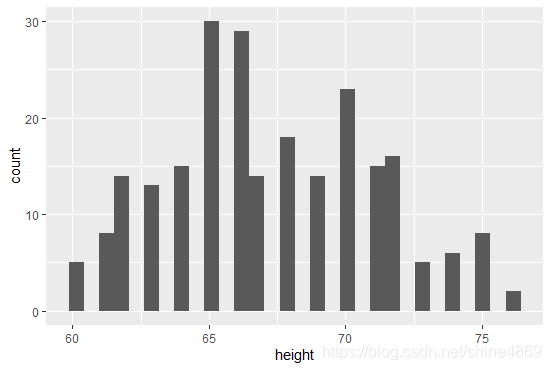
命令解释:
ggplot()初始化图形时,首先需要指定数据集来源data以及绘制的变量。aes函数(全称aesthetics,指用视觉的方式呈递信息)中则是指定每个变量所扮演的角色。绘制的变量以height身高作为x轴,geom_hist()则是指定绘制的图形类型为直方图。
II.绘制箱线图
ggplot(data=singer,aes(x=voice.part,y=height,fill=voice.part,color=voice.part))+geom_boxplot(alpha=0.7)

命令解释:
相比I中,aes函数中多了fill及color的设置,fill则是指以voice.part的值进行区别,color则是以voice.part的值进行赋值颜色。alpha表示透明度的设置,范围为0到1。
III.更多绘图类型及参数设置
| 函数 | 绘图类型 | 参数设置 |
|---|---|---|
| geom_bar() | 条形图 | Color、fill、alpha |
| geom_density() | 密度图 | Color、fill、alpha、 linetype |
| geom_rug | 地毯图 | Color、side |
| geom_point() | 散点图 | Color、shape、alpha、size |
| geom_violin() | 小提琴图 | Color、fill、alpha、linetype |
二、精雕细琢
以上做出来的图还是比较粗糙的,接下来将逐步对其进行微调
(1) 添加标题、横纵轴标签
ggplot(data=singer,aes(x=voice.part,y=height,fill=voice.part,color=voice.part))+geom_boxplot(alpha=0.7)+labs(x="音域",y="身高",title="不同音域的歌手身高分布箱线图")

添加标题及横纵轴标签后,不难看出,还是有很多小问题的。比如图片标题没有居中,横纵轴标题较小,字体样式不统一等。以下,将通过element_text函数继续进行调整。
(2) 图片标题字体、大小、样式设置
#plot.title表示图片标题
#face表示字体样式,共四种类型:plain,"italic"(斜体), "bold"(粗体), "bold.italic" (或者使用family指定其他字体样式)
#size指定字体大小
#hjust标题水平位置(0.5则表示水平居中)
#R里面的说明虽是0-1,实际上可以取到超过这个范围的值,还可以取负值!
ggplot(data=singer,aes(x=voice.part,y=height,fill=voice.part,color=voice.part))+geom_boxplot(alpha=0.7)+labs(x="音域",y="身高",title="不同音域的歌手身高分布箱线图")+theme(plot.title=element_text(face="plain",size=15,hjust=0.5))

(3) 坐标轴标题及标签字体、大小及样式设置
I.坐标轴标题样式调整
#axis.title.x:对x轴标题进行调整
#axis.title.y:对y轴标题进行调整
#axis.title: 对整体坐标轴标题统一调整
#vjust的设置是为了将x轴标题离绘图区远一点
windowsFonts(myFont = windowsFont("宋体"))  #读取电脑自带字体
ggplot(data=singer,aes(x=voice.part,y=height,fill=voice.part,color=voice.part))+geom_boxplot(alpha=0.7)+labs(x="音域",y="身高",title="不同音域的歌手身高分布箱线图")+theme(plot.title = element_text(face="plain",size=15,hjust=0.5),axis.title.x = element_text(family="myFont",size=15,vjust=-0.5), axis.title.y = element_text(family="myFont",size=15))

这样调整后的图和第一张图相比,整体协调性是不是好多了?
II.坐标轴标签样式调整
#axis.text.x对x轴标签调整
#axis.text.y对y轴标签调整
#axis.text 统一对坐标轴标签调整
#angle旋转的角度
windowsFonts(myFont = windowsFont("宋体"))
windowsFonts(myFont1 = windowsFont("微软雅黑"))  #横纵轴标签样式
ggplot(data=singer,aes(x=voice.part,y=height,fill=voice.part,color=voice.part))+geom_boxplot(alpha=0.7)+labs(x="音域",y="身高",title="不同音域的歌手身高分布箱线图")+theme(plot.title = element_text(face="plain",size=15,hjust=0.5),axis.title.x = element_text(family="myFont",size=15,vjust=-0.5),axis.title.y = element_text(family="myFont",size=15),axis.text.x = element_text(family="myFont1",angle = 90,size=12),axis.text.y = element_text(family="myFont1",size=12))

调整后,横纵轴标签变大了一些,且横轴标签通过旋转了90度,显得不是很拥挤。当然,如果希望对纵轴的数值从0开始且紧贴坐标原点,可以加上scale_y_continuous(limits=c(0,80),expand=c(0,0)),得到的图如下(个人感觉不美观且丧失了很多信息

(4) 颜色设置
一般软件里自带的颜色都挺花里胡哨的,以下三种方法可以自定义设置颜色。
I. 指定颜色
这里推荐一个配色网站LOL Colors,对比色和渐变色都挺不错的,日常绘图基本够用了。
命令:scale_fill_manual(values=c(""))
colors=c("#34314c","#47b8e0","#ffc952","#ff7473","#79bd9a","#79a8a9","#EC7357","#FFEEE4") ggplot(data=singer,aes(x=voice.part,y=height,fill=voice.part,color=voice.part))+geom_boxplot(alpha=0.7)+labs(x="音域",y="身高",title="不同音域的歌手身高分布箱线图")+theme(plot.title = element_text(face="plain",size=15,hjust=0.5),axis.title.x = element_text(family="myFont",size=15,vjust=-0.5),axis.title.y = element_text(family="myFont",size=15),axis.text.x = element_text(family="myFont1",angle = 90,size=12),axis.text.y = element_text(family="myFont1",size=12))+scale_fill_manual(values=colors)

II. 使用调色板
如果不想自己去取颜色,还可以调用R中自带的调色板
命令:scale_fill_brewer(palette='xxx')

RColorBrewer::display.brewer.all()  #查看调色板样式
ggplot(data=singer,aes(x=voice.part,y=height,fill=voice.part,color=voice.part))+geom_boxplot(alpha=0.7)+labs(x="音域",y="身高",title="不同音域的歌手身高分布箱线图")+theme(plot.title = element_text(face="plain",size=15,hjust=0.5),axis.title.x = element_text(family="myFont",size=15,vjust=-0.5),axis.title.y = element_text(family="myFont",size=15),axis.text.x = element_text(family="myFont1",angle = 90,size=12),axis.text.y = element_text(family="myFont1",size=12))+scale_fill_brewer(palette='Set2')

(5) 图例样式设置
I.取消图例标题+调整图例位置
命令:theme(legend.title=element_blank())
theme(legend.position="top/bottom/right/left")
ggplot(data=singer,aes(x=voice.part,y=height,fill=voice.part,color=voice.part))+geom_boxplot(alpha=0.7)+labs(x="音域",y="身高",title="不同音域的歌手身高分布箱线图")+theme(plot.title = element_text(face="plain",size=15,hjust=0.5),axis.title.x = element_text(family="myFont",size=15,vjust=-0.5),axis.title.y = element_text(family="myFont",size=15),axis.text.x = element_text(family="myFont1",angle = 90,size=12),axis.text.y = element_text(family="myFont1",size=12),legend.title=element_blank(),legend.position="top")+scale_fill_brewer(palette='Set2')

当然legend.position也可以传入具体位置向量,如legend.position=c(0.5,0.6)
II.更改图例顺序
主要修改数据框中变量的因子顺序
singer$voice.part=factor(singer$voice.part,level=rev(levels(singer$voice.part))) #逆序排列

此外,修改图例的顺序还可以通过scale_fill_discrete(breaks=c())等命令(但是它是将原图例和新的图例一起呈现的
(6) 多图汇总
当需要结合多组图片进行说明时,就需要将其放置一张画布上呈现。而普通设置画布的方式par(mfrow=c(n,m)),在ggplot中是不起作用的。以下,介绍两种多图呈现的方式。使用的数据集为鸢尾花
I. Rmisc包下的multiplot函数
library(Rmisc)
p1 <- ggplot(data=iris,aes(x=Sepal.Length,y=Sepal.Width))+geom_point()
p2 <-ggplot(data=iris,aes(x=Species,y=Petal.Width,color=Species))+geom_boxplot()
p3 <- ggplot(data=iris,aes(x=Sepal.Width))+geom_density()
p4 <- ggplot(data=iris,aes(x=Petal.Length))+geom_histogram()
multiplot(p1,p2,p3,p4,cols=2)

这种方式虽然快捷,但它是默认按列进行排列的,无法指定各个图片放置的位置,当然也无法指定某个图片占一排的情况。
II. grid包下的layout函数
library(grid)
pushViewport(viewport(layout = grid.layout(2,2)))   #指定画图大小vplayout <- function(x,y){viewport(layout.pos.row = x,layout.pos.col = y)
}
p1 <- ggplot(data=iris,aes(x=Sepal.Length,y=Sepal.Width))+geom_point()
p2 <-ggplot(data=iris,aes(x=Species,y=Petal.Width,color=Species))+geom_boxplot()
p3 <- ggplot(data=iris,aes(x=Sepal.Width))+geom_density()print(p1,vp=vplayout(1,1:2))   #图片p1占画布的第一行print(p2,vp=vplayout(2,1))  #图片p2占画布第二行的第一个位置print(p3,vp=vplayout(2,2))  #图片p3占画布第二行的第二个位置

通过编写自定义函数,可以实现对图片指定位置摆放
三、ggplot2中的数据变换
通过上述的介绍,我们可以知道,其实ggplot中图例的出现是由于aes中fill(或者color、shape)的设置。它们均需要指定为一个类别型变量,而实际中数据排列方式通常如左图所示,ggplot2需要的是右图排列样式。


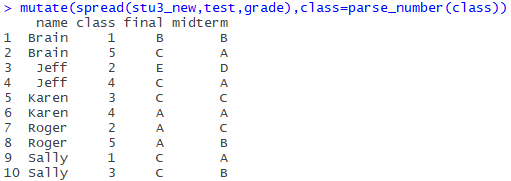
这种差异导致使用ggplot直接作图十分不便,因此,需要对原数据集进行转变。转变方式在之前博客中有介绍过五分钟学会四种宽数据转长数据的方法,这里再介绍一种新的方法:melt
library(reshape2)
data <- read.table("clipboard",header=T)
new_data <- melt(data,id='date',measure=c("Anhui","Chongqing"))
new_data
此时,再用ggplot绘图就十分方便啦
windowsFonts(myFont = windowsFont("宋体"))
windowsFonts(myFont1 = windowsFont("微软雅黑"))  #横纵轴标签样式
ggplot(data=new_data,aes(x=date,y=value,color=variable,group=variable))+geom_point()+geom_line()+labs(x="日期",y="确诊人数",title="2020/1/30-2020/2/2日确诊人数(安徽、重庆)")+theme(plot.title = element_text(family = "myFont",size=15,hjust=0.5),axis.title.x = element_text(family="myFont",size=15,vjust=-0.5),axis.title.y = element_text(family="myFont",size=15),axis.text.x = element_text(family="myFont1",angle = 90,size=12),axis.text.y = element_text(family="myFont1",size=12),legend.title=element_blank())

当然,关于ggplot的学习远不止这些,还有很多细节控制命令,因篇幅限制尚未涉及。有兴趣的朋友可参考R-cookbook。如有错误,还望指出。


