序言
笔者对国内股票的程序API不甚了解,所以使用国外的股票平台Finazon,请读者自行参考。
在本文中,我使用Finazon获取我们想预测的股票的价格时间序列数据,然后,我们将这些数据输入到 ChatGPT 生成的程序中。包括数据准备、模型构建、预测、模型评估在内的所有流程都将由 ChatGPT 负责
项目摘要
通过询问chatGPT关于股价预测的模型和方法论之后,获得了以下内容
1. 获取数据
2. 线性回归
3. 基本 LSTM 模型
4. 改进 LSTM 模型
5. 超参数调优
整篇文章将遵循这个大纲,除了第一部分获取数据之外,所有其他部分将完全由 ChatGPT 单独驱动。
1. 使用 Finazon 获取数据
为了建立一个能够以更高的准确度进行预测的成功的机器学习模型,质量和可靠性的数据必须优先于其他任何因素。这就是Finazon发挥作用的地方。Finazon 是一个各种性质数据的市场,这些数据直接从 SIP、Coinbase、Binance 等授权来源提取。
对于这个项目,我们将预测苹果的股价,为此我们需要其长期时间序列数据。因此,我选择了SIP提供的Finazon美国股市数据,订阅数据后,我使用以下代码提取了Apple过去4000天(大约10-11年)的历史数据:
import pandas as pd
import requests
from datetime import datetime as dtapi_key = 'YOUR API KEY'
page_no = [0,1,2,3,4]
data_dict = []for i in page_no: hist_json = requests.get(f'https://api.finazon.io/latest/time_series?publisher=sip&ticker=AAPL&interval=1d&page={i}&page_size=1000&order=desc&apikey={api_key}').json()['data']data_dict.append(hist_json)aapl_df = pd.DataFrame(columns = ['t', 'o', 'h', 'l', 'c', 'v'])for i in range(0,len(data_dict)):df = pd.DataFrame(data_dict[i])aapl_df = aapl_df.append(df, ignore_index = True)aapl_df = aapl_df[::-1].reset_index(drop = True)
aapl_df.columns = ['Date', 'Open', 'High', 'Low', 'Close', 'Volume']
aapl_df.Date = pd.to_datetime(aapl_df.Date.astype(int), unit = 's').dt.date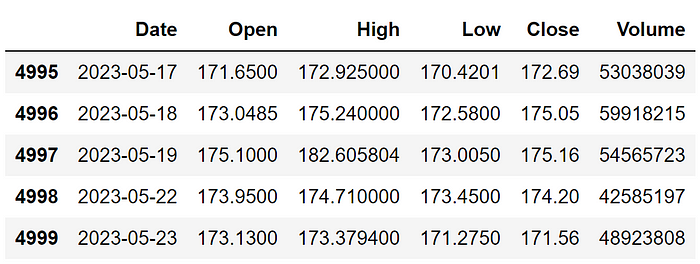
aapl_df.tail()这段代码没有什么复杂的地方。为了代码的顺利运行,请确保替换YOUR API KEY为你的 Finazon API 密钥,您可以在创建账号后获取该密钥。最终的数据框
2. 线性回归
我不想直接开始构建 LSTM 模型,而是想慢慢地使用 ChatGPT 来了解机器人给出的代码生成的结果。我要求它为我编写一个 Python 程序,使用 Scikit Learn 构建基本的线性回归模型,以预测股票价格。它最初为我提供了构建回归模型应遵循的步骤,然后编写了以下示例代码:
import pandas as pd
import numpy as np
from sklearn.linear_model import LinearRegression
from sklearn.model_selection import train_test_split
from sklearn.preprocessing import StandardScaler
from sklearn.metrics import r2_score, mean_squared_error
import matplotlib.pyplot as plt# Get the stock data
df = pd.read_csv('aapl.csv').dropna()
df = df.set_index('Date')# Add a column for the target variable
df['Price'] = df['Close']# Define the features and target variable
features = ['Open', 'High', 'Low', 'Volume']
target = 'Price'# Split the data into training and testing sets
train_size = 0.8
train_data = df[:int(train_size * len(df))]
test_data = df[int(train_size * len(df)):]# Normalize the data
scaler = StandardScaler()
train_data[features] = scaler.fit_transform(train_data[features])
test_data[features] = scaler.transform(test_data[features])# Train the model
model = LinearRegression()
model.fit(train_data[features], train_data[target])# Make predictions on the test data
predictions = model.predict(test_data[features])# Compute the R^2 score and RMSE
r2 = r2_score(test_data[target], predictions)
rmse = np.sqrt(mean_squared_error(test_data[target], predictions))print(f'R^2 score: {r2:.4f}')
print(f'RMSE: {rmse:.4f}')# Plot the predicted and actual values
plt.plot(test_data[target].values, label='Actual')
plt.plot(predictions, label='Predicted')
plt.legend()
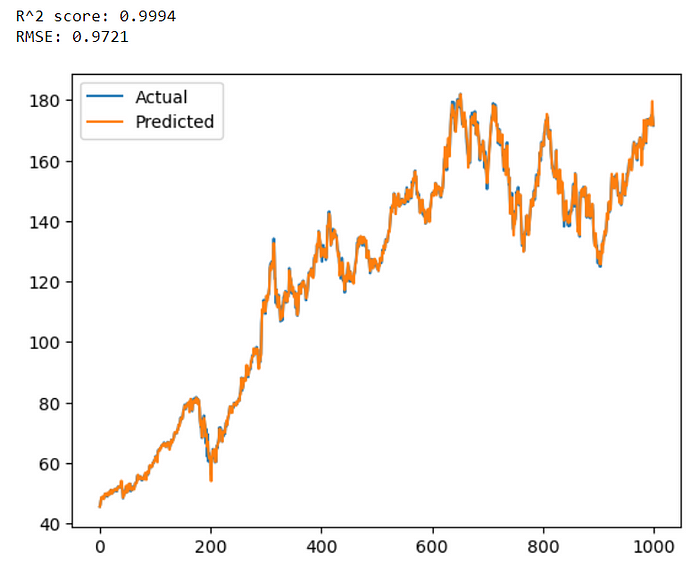
plt.show()代码的输出结果:
3. 基本的 LSTM 模型
让 ChatGPT 生成一个 Python 程序来构建 LSTM 模型来预测股票价格了。先简单介绍一下 LSTM:长短期记忆 (LSTM) 是一种复杂的神经网络,也是分析顺序数据的强大工具。它有选择地存储或忘记信息以理解复杂的数据序列。这使得它非常适合语音识别、自然语言处理和分析时间序列数据等任务。以下是 ChatGPT 生成的用于构建预测 LSTM 模型的代码:
import numpy as np
import pandas as pd
import matplotlib.pyplot as plt
from sklearn.metrics import *
from sklearn.preprocessing import MinMaxScaler
from tensorflow.keras.models import Sequential
from tensorflow.keras.layers import LSTM, Dense, Dropout# Load the stock price data
df = pd.read_csv('aapl.csv').dropna()
df = df.set_index('Date')# Preprocess the data
scaler = MinMaxScaler()
df_scaled = scaler.fit_transform(df['Close'].values.reshape(-1, 1))# Define the training and testing data
train_size = int(len(df_scaled) * 0.8)
train_data = df_scaled[:train_size, :]
test_data = df_scaled[train_size:, :]# Define the function to create a sliding window dataset
def create_dataset(dataset, time_steps=1):X_data, y_data = [], []for i in range(len(dataset)-time_steps-1):X_data.append(dataset[i:(i+time_steps), 0])y_data.append(dataset[i + time_steps, 0])return np.array(X_data), np.array(y_data)# Define the time steps and create the sliding window dataset
time_steps = 60
X_train, y_train = create_dataset(train_data, time_steps)
X_test, y_test = create_dataset(test_data, time_steps)# Reshape the data for LSTM input
X_train = np.reshape(X_train, (X_train.shape[0], X_train.shape[1], 1))
X_test = np.reshape(X_test, (X_test.shape[0], X_test.shape[1], 1))# Define the LSTM model architecture
model = Sequential()
model.add(LSTM(units=64, return_sequences=True, input_shape=(X_train.shape[1], 1)))
model.add(Dropout(0.2))
model.add(LSTM(units=64, return_sequences=True))
model.add(Dropout(0.2))
model.add(LSTM(units=64, return_sequences=False))
model.add(Dropout(0.2))
model.add(Dense(units=1))# Compile the model
model.compile(optimizer='adam', loss='mean_squared_error')# Train the model
model.fit(X_train, y_train, epochs=50, batch_size=64, validation_data=(X_test, y_test), verbose=1)# Make predictions
y_pred = model.predict(X_test)# Inverse transform the predicted and actual values
y_pred = scaler.inverse_transform(y_pred)
y_test = y_test.reshape(y_pred.shape[0], 1)
y_test = scaler.inverse_transform(y_test)# Evaluate the model
mse = mean_squared_error(y_test, y_pred)
msle = mean_squared_log_error(y_test, y_pred)
mae = mean_absolute_error(y_test, y_pred)
r2 = r2_score(y_test, y_pred)print('MSE: ', mse)
print('MSLE: ', msle)
print('MAE: ', mae)
print('R-squared: ', r2)# Plot the predicted vs actual values
plt.figure(figsize=(10, 6))
plt.style.use('fivethirtyeight')
plt.plot(y_test, label='Actual', linewidth = 3, alpha = 0.4)
plt.plot(y_pred, label='Predicted', linewidth = 1.5)
plt.xlabel('Days')
plt.ylabel('Stock Price')
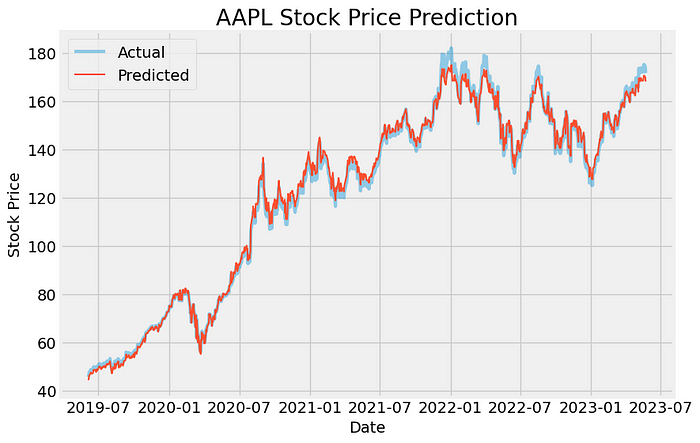
plt.title('AAPL Stock Price Prediction')
plt.legend()
plt.show()输出结果如下:

4.改进LSTM模型
我刚刚构建并用于预测的 LSTM 模型本质上非常简单,并且可以在各个方面进行改进。所以我要求 ChatGPT 给我一些改进代码以获得更好的 LSTM 模型的建议,它是这样说的:
- 增加 LSTM 层数:提高模型性能的一种方法是向模型添加更多 LSTM 层。这可以帮助模型捕获数据中更复杂的模式。
- 增加每层神经元数量:提高模型性能的另一种方法是增加每层 LSTM 神经元数量。这可以帮助模型学习输入特征和目标变量之间更复杂的关系。
- 调整学习率:学习率决定了模型根据预测值和实际值之间的误差调整权重的程度。较小的学习率会减慢训练过程,而较大的学习率会导致模型超出最佳权重。调整学习率可以提高模型的性能。
- 添加 dropout 层:可以将 Dropout 层添加到模型中以防止过度拟合。该技术在训练过程中随机丢弃一些神经元,这可以帮助模型更好地泛化到新数据。
- 尝试不同的激活函数:激活函数的选择会影响模型学习数据中复杂关系的能力。尝试不同的激活函数(例如 tanh、relu 和 sigmoid)有助于提高模型的性能。
- 使用更多数据:增加用于训练模型的数据量可以提高其性能。这可以通过增加历史数据的年数或使用新闻情绪数据或技术指标等附加功能来实现。
- 使用不同的损失函数:损失函数的选择也会影响模型的性能。使用更适合时间序列数据的损失函数,例如均方对数误差 (MSLE),可以帮助提高模型的准确性。
我要求 ChatGPT 在之前的代码中包含所有这些建议,它返回给我这个更新版本:
import numpy as np
import pandas as pd
import matplotlib.pyplot as plt
from sklearn.metrics import *
from sklearn.preprocessing import MinMaxScaler
from tensorflow.keras.models import Sequential
from tensorflow.keras.layers import LSTM, Dense, Dropout
from tensorflow.keras.callbacks import EarlyStopping# Obtain stock data for Apple
df = pd.read_csv('aapl.csv').dropna()# Extract the closing prices
close_prices = df[["Date", "Close"]].copy()
close_prices.columns = ["ds", "y"]
close_prices.set_index("ds", inplace=True)# Normalize the data
scaler = MinMaxScaler(feature_range=(0, 1))
close_prices_scaled = scaler.fit_transform(close_prices)# Create training and testing data
train_size = int(len(close_prices) * 0.8)
train_data = close_prices_scaled[:train_size]
test_data = close_prices_scaled[train_size:]# Define the number of time steps to look back
look_back = 60# Create training and testing data for the LSTM model
def create_data(data):X, Y = [], []for i in range(look_back, len(data)):X.append(data[i - look_back : i, 0])Y.append(data[i, 0])X, Y = np.array(X), np.array(Y)X = np.reshape(X, (X.shape[0], X.shape[1], 1))return X, YX_train, Y_train = create_data(train_data)
X_test, Y_test = create_data(test_data)# Define the LSTM model
model = Sequential()model.add(LSTM(units=64, return_sequences=True, input_shape=(X_train.shape[1], 1)))
model.add(Dropout(0.2))model.add(LSTM(units=128, return_sequences=True))
model.add(Dropout(0.2))model.add(LSTM(units=64))
model.add(Dropout(0.2))model.add(Dense(units=1))# Compile the model
model.compile(optimizer="adam", loss="mean_squared_logarithmic_error")# Define the early stopping criteria
early_stop = EarlyStopping(monitor="val_loss", patience=10)# Fit the model to the training data
history = model.fit(X_train, Y_train, epochs=100, batch_size=32, validation_data=(X_test, Y_test), callbacks=[early_stop])# Make predictions on the test data
y_pred = model.predict(X_test)# Inverse the scaling of the data
y_pred = scaler.inverse_transform(y_pred)
Y_test = scaler.inverse_transform([Y_test])# Evaluate the model
mse = mean_squared_error(Y_test[0], y_pred)
msle = mean_squared_log_error(Y_test[0], y_pred)
mae = mean_absolute_error(Y_test[0], y_pred)
r2 = r2_score(Y_test[0], y_pred)print('MSE: ', mse)
print('MSLE: ', msle)
print('MAE: ', mae)
print('R-squared: ', r2)# Plot the predicted vs actual values
plt.figure(figsize=(10, 6))
plt.style.use('fivethirtyeight')
plt.plot(df["Date"][train_size + look_back :], Y_test.flatten(), label="Actual", linewidth = 3, alpha = 0.4)
plt.plot(df["Date"][train_size + look_back :], y_pred.flatten(), label="Predicted", linewidth = 1.5)
plt.title("LSTM: Actual vs Predicted")
plt.xlabel("Date")
plt.ylabel("Stock Price")
plt.legend()
plt.show()
此代码是先前代码的扩展版本,其中包含 ChatGPT 建议的所有小更改。根据ChatGPT的说法:它增加了LSTM层数,增加了每层神经元的数量,添加了dropout层,并调整了学习率。它还通过对整个历史数据进行训练来使用更多的数据,并使用不同的损失函数,均方对数误差(MSLE),这更适合时间序列数据。
在我看来,代码没有任何重大更改,但这是可以接受的,因为没有必要进行大量修改来改进现有模型。以下是两个模型结果的并排比较(上:之前的模型,下:改进的模型):
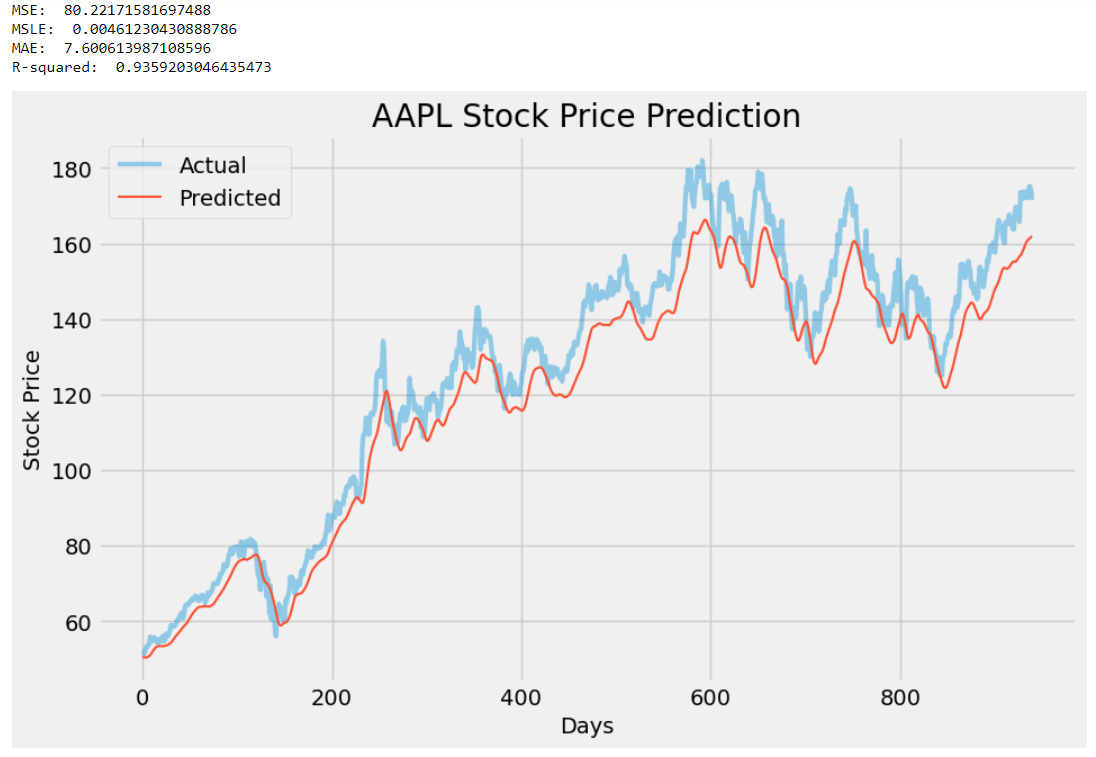
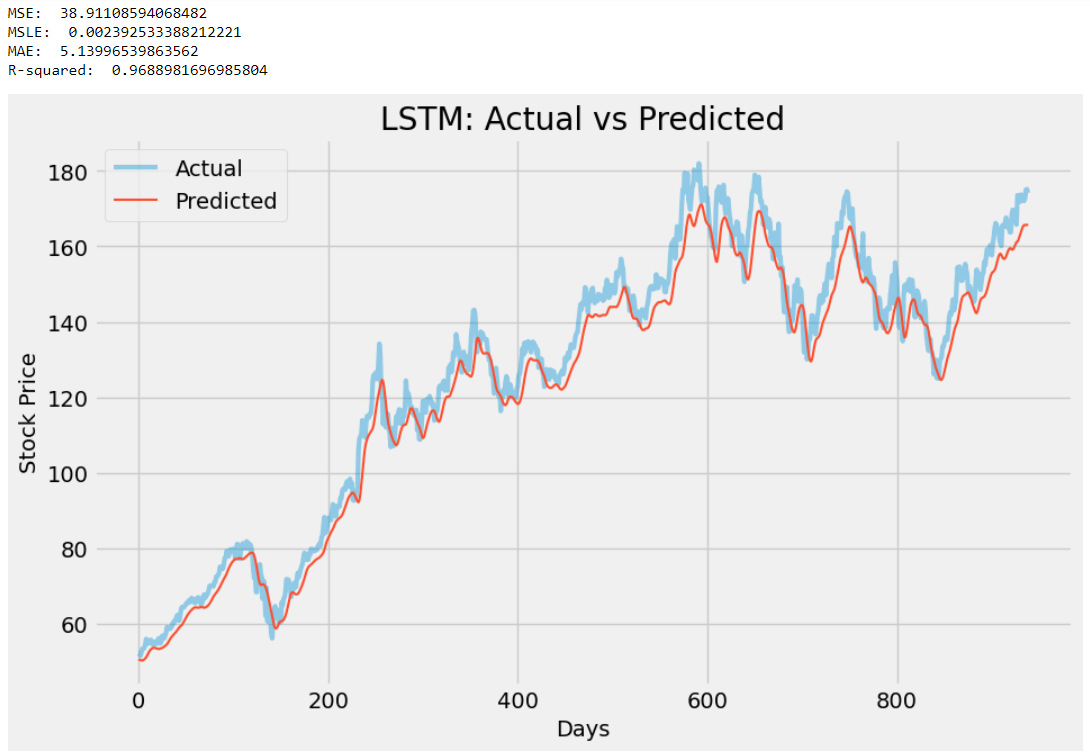
通过观察结果,我们可以得出结论,LSTM模型的性能有了一些改进。新模型的 R2 分数从 0.93 增加到 0.96,表明预测精度更高,并且 MSE、MSLE 和 MAE 分数均显着降低,使其更加接近于零。
5. 超参数调优
如果没有超参数调整,任何人工智能和机器学习项目都是不完整的。以下是有关超参数调整的一些背景知识:涉及调整机器学习模型的设置以提高其性能的过程称为超参数调整。这些设置称为超参数,是在训练模型之前设置的,包括学习率、层数和神经元等参数。微调这些设置的主要目的是提高模型的预测准确性。以下是 ChatGPT 在要求对先前生成的模型执行超参数调整时生成的代码:
import numpy as np
import pandas as pd
from sklearn.preprocessing import MinMaxScaler
from tensorflow.keras.models import Sequential
from tensorflow.keras.layers import Dense, LSTM, Dropout
from tensorflow.keras.optimizers import Adam
from tensorflow.keras.wrappers.scikit_learn import KerasRegressor
from sklearn.model_selection import GridSearchCV, TimeSeriesSplit# Download the data
df = pd.read_csv('aapl.csv').dropna()
df = df.set_index('Date')# Scale the data
scaler = MinMaxScaler()
scaled_data = scaler.fit_transform(df['Close'].values.reshape(-1, 1))# Define the training and test sets
train_size = int(len(scaled_data) * 0.8)
train_data = scaled_data[:train_size]
test_data = scaled_data[train_size:]# Define the function to create the LSTM model
def create_model(neurons=50, layers=2, dropout=0.2, learning_rate=0.001):model = Sequential()for i in range(layers):model.add(LSTM(units=neurons, return_sequences=True, input_shape=(train_data.shape[1], 1)))model.add(Dropout(dropout))model.add(LSTM(units=neurons))model.add(Dropout(dropout))model.add(Dense(units=1))optimizer = Adam(learning_rate=learning_rate)model.compile(optimizer=optimizer, loss='mean_squared_error')return model# Define the parameter grid for hyperparameter tuning
param_grid = {'neurons': [50, 100, 200],'layers': [2, 3],'dropout': [0.2, 0.3],'learning_rate': [0.001, 0.01]
}# Define the time series split for cross-validation
tscv = TimeSeriesSplit(n_splits=3)# Create the KerasRegressor for hyperparameter tuning
model = KerasRegressor(build_fn=create_model, epochs=50, batch_size=32, verbose=0)# Perform the hyperparameter tuning
grid = GridSearchCV(estimator=model, param_grid=param_grid, cv=tscv, scoring='neg_mean_squared_error', n_jobs=-1)
grid_result = grid.fit(train_data, train_data)# Print the best parameters and score
print("Best parameters: ", grid_result.best_params_)
print("Best score: ", np.sqrt(-grid_result.best_score_))# Use the best model to make predictions on the test data
best_model = grid_result.best_estimator_.model
predictions = best_model.predict(test_data.reshape(-1, 1))
predictions = scaler.inverse_transform(predictions)# Plot the predictions and actual values
import matplotlib.pyplot as plt# Plot the predicted vs actual values
plt.figure(figsize=(10, 6))
plt.style.use('fivethirtyeight')
plt.plot(pd.to_datetime(df.index[train_size:]), df['Close'][train_size:], label='Actual', linewidth = 3, alpha = 0.4)
plt.plot(pd.to_datetime(df.index[train_size:]), predictions, label='Predicted', linewidth = 1.5)
plt.title(f"AAPL Stock Price Prediction")
plt.xlabel("Date")
plt.ylabel("Stock Price")
plt.legend()
plt.show()
最佳参数: {'dropout': 0.3, 'layers': 2, 'learning_rate': 0.001, 'neurons': 200}
最佳得分: 0.02022405674165489
ChatGPT进一步使用最佳参数来构建模型并进行预测。该图是超参数调优得出的模型的最终结果:
结论
尽管 ChatGPT 帮助我们编写了一些非常好的代码来预测股票价格,但这些模型在现实市场中大多已经过时,因为价格也会由情绪驱动,而这些因素无法使用由一个机器人去编写的代码。
这并不意味着我们迄今为止所做的工作绝对是垃圾,而是实际分析的起点。通过这些人工智能模型了解价格变动为我们提供了分析股票时应遵循的一些方向或方法布局。因此,在做出投资决策时,预测分析只能被视为次要工具,而不是盲目相信它。