背景
散点图多维Series如何通过dataset组件传参完成散点图绘制呢?如果是多个序列的散点图,则需要单独对每个序列设置encode指定对应的y轴的取值列。
应用实例
以demo中的气泡图为例,结合dataset教程最后一个散点图的例子,完成数据配置过程。定义二维dataset数据:
var data = [
["Income","Life Expectancy","Population","Country","Year"],
[28604,77,17096869,'Australia',1990],
[31163,77.4,27662440,'Canada',1990],
[1516,68,1154605773,'China',1990],
[13670,74.7,10582082,'Cuba',1990],
[28599,75,4986705,'Finland',1990],
[29476,77.1,56943299,'France',1990],
[31476,75.4,78958237,'Germany',1990],
[28666,78.1,254830,'Iceland',1990],
[1777,57.7,870601776,'India',1990],
[29550,79.1,122249285,'Japan',1990],
[2076,67.9,20194354,'North Korea',1990],
[12087,72,42972254,'South Korea',1990],
[24021,75.4,3397534,'New Zealand',1990] ];
设置图形配置,只使用dataset的头两列数据,展示国家的收入和寿命长度的散点图:
option = {legend : {},tooltip : {},dataset : {source : data},xAxis : {type : 'category',splitLine : {lineStyle : {type : 'dashed'}}},yAxis : {splitLine : {lineStyle : {type : 'dashed'}},scale : true},// Declare several bar series, each will be mapped// to a column of dataset.source by default.series : [ {type : 'scatter',encode : {// 将 "Country" 列映射到 X 轴。x : 'Country',// 将 "Income" 列映射到 Y 轴。y : 'Income'},symbolSize : function(data) {return Math.sqrt(data[2]) / 5e2;},label : {emphasis : {show : true,formatter : function(param) {return param.data[3];},position : 'top'}},itemStyle : {normal : {shadowBlur : 10,shadowColor : 'rgba(120, 36, 50, 0.5)',shadowOffsetY : 5,color : new echarts.graphic.RadialGradient(0.4, 0.3, 1, [ {offset : 0,color : 'rgb(251, 118, 123)'}, {offset : 1,color : 'rgb(204, 46, 72)'} ])}}}, {type : 'scatter',encode : {// 将 "Country" 列映射到 X 轴。x : 'Country',// 将 "Life Expectancy" 列映射到 Y 轴。y : 'Life Expectancy'},symbolSize : function(data) {return Math.sqrt(data[2]) / 5e2;},label : {emphasis : {show : true,formatter : function(param) {return param.data[3];},position : 'top'}},itemStyle : {normal : {shadowBlur : 10,shadowColor : 'rgba(25, 100, 150, 0.5)',shadowOffsetY : 5,color : new echarts.graphic.RadialGradient(0.4, 0.3, 1, [ {offset : 0,color : 'rgb(129, 227, 238)'}, {offset : 1,color : 'rgb(25, 183, 207)'} ])}}} ]
};
运行结果:
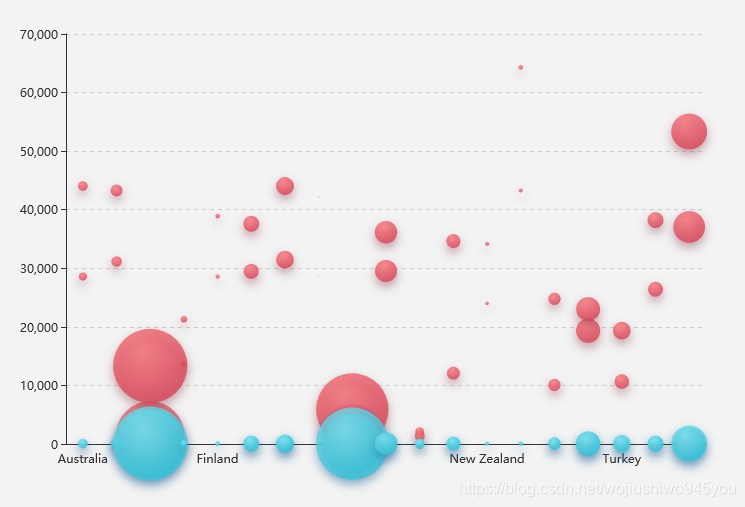
默认情况下,如果不对每个series指定encode属性,那么它将第一列映射到x轴,第二三列的值作为Series的数据,去掉series中的encode,验证得到的图形为:

结论:如果默认不指定任何配置的情况下,必须保证提供的Dataset至少有series.length+1列数据:第一列映射为X轴,其他几列对应Series的数据。
且这些列必须都是数值类型。
如果把Country列作为第一列数据:
["Country","Income","Life Expectancy","Population","Year"],['Australia',28604,77,17096869,1990],['Canada',31163,77.4,27662440,1990],['China',1516,68,1154605773,1990],['Cuba',13670,74.7,10582082,1990]
这种数据配置下默认配置无法出现正确的散点图,此时即使配置了series的encode映射y轴的数据,也没有数据,所以推测散点图的映射规则为:
第一,至少需要提供3列的数值的数据,可以通过制定Series的定制x和y轴。
第二,全局的encode配置无效。即我想通过全局配置x为Country列、y轴展示Income和LifeExpectancy’是无法成功。
