当我们柱状图中X轴数据太多的时候,会自动把柱形的宽度挤的很细,带来的交互非常不好,因此就有一个属性来解决:dataZoom
第一种简易的版本,横向滚动。

dataZoom: {show: true, // 为true 滚动条出现realtime: true, // 实时更新type:'slider', // 有type这个属性,滚动条在最下面,也可以不行,写y:36,这表示距离顶端36px,一般就是在图上面。height: 12, // 表示滚动条的高度,也就是粗细start: 20, // 表示默认展示20%~80%这一段。end: 80,},第二种:
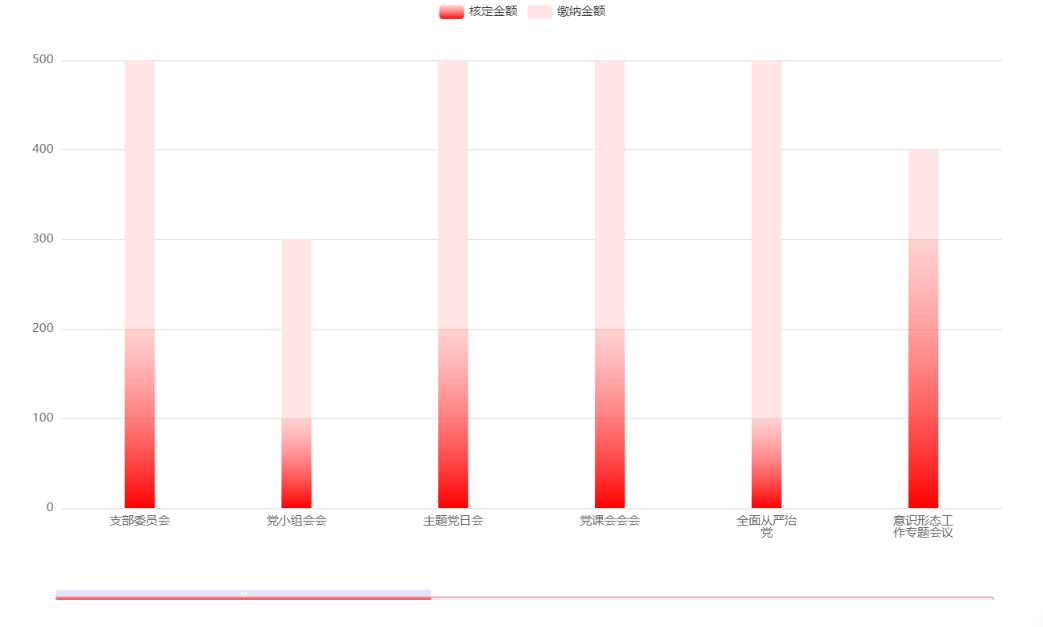
dataZoom: [//给x轴设置滚动条{type: 'slider',//slider表示有滑动块的,inside表示内置的// startValue: 8,//可用于设置开始显示的柱子的长度// endValue: 1,//可用于设置结束显示的柱子的长度start: 0,//默认为0 可设置滚动条从在后进行展示end: 40,//默认为100show: true,xAxisIndex: [0],handleSize: 0,//滑动条的 左右2个滑动条的大小height: 12,//组件高度left: '5%', //左边的距离right: '5%',//右边的距离bottom: -2,//右边的距离borderColor: "#f68b8f", //两边未选中的滑动条区域的颜色fillerColor: '#ff5e70',// 两边选中的滑动条区域的颜色backgroundColor: '#eee',//两边未选中的滑动条区域的颜色showDataShadow: false,//是否显示数据阴影 默认autoshowDetail: false,//即拖拽时候是否显示详细数值信息 默认truerealtime: true, //是否实时更新filterMode: 'filter',handleStyle: {borderRadius: '20',},},//下面这个属性是里面拖到{type: 'inside',show: true,xAxisIndex: [0], // 与上面xAxisIndex对应start: 0,//默认为1end: 100,//默认为100moveOnMouseWheel: false, // 鼠标滚轮时是否滚动preventDefaultMouseMove: false, // 是否阻止默认的鼠标移动事件},],第三种:
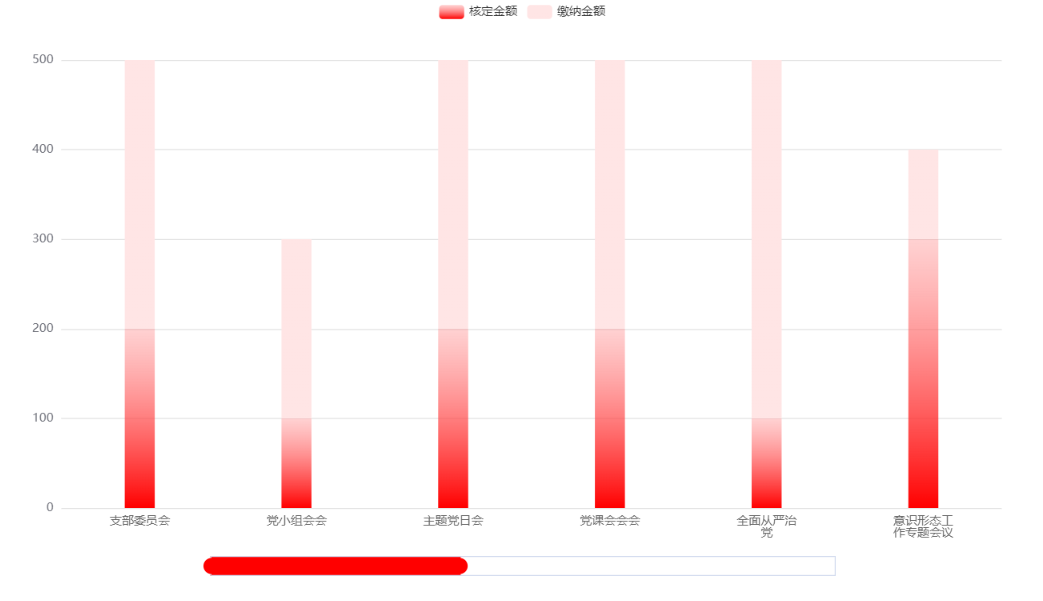
dataZoom: [{type: 'slider',width: '60%',start: 0,end: 40,showDataShadow: false,fillerColor: '#ff0000',borderRadius:'50%',moveHandleSize: 0,moveHandleStyle: {},left: '20%',// right: '80%',height: 20,handleSize: '80%', // 滑动条的 左右2个滑动条的大小handleIcon:'path://M512,512m-448,0a448,448,0,1,0,896,0a448,448,0,1,0,-896,0Z',handleStyle: {borderWidth: 0, // 边框宽度color: '#ff0000'}},{type: 'inside'}]


