关于vue echart3D 饼图开发
首先要先下载 "echarts-gl", 放在main.js
npm install echarts-gl --save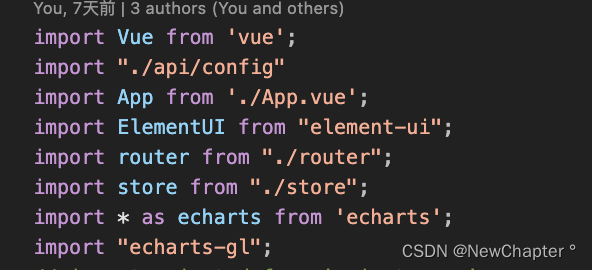
<template><div class="cointan"><!-- 3d环形图 --><div class="chart" id="cityGreenLand-charts"></div></div></template><script>export default {name: 'rightCenter',props: {msg: String},data() {return {optionData: [{name: '已用空间',height: 5,value: 20,pieValue: 0,itemStyle: {color: '#00D7E9',opacity: 0.6}}, {name: '可用空间',height: 10,value: 12,pieValue: 0,itemStyle: {color: '#FFDE03',opacity: 0.8}}],totalNum:0,//年级总获奖人数}},mounted(){this.getJiang()},methods:{//各年级获奖人数getJiang() {this.$nextTick(function() {this.init();});},init() {//构建3d饼状图let myChart = this.$echarts.init(document.getElementById('cityGreenLand-charts'));// 传入数据生成 optionthis.option = this.getPie3D(this.optionData, 0);myChart.setOption(this.option);//是否需要label指引线,如果要就添加一个透明的2d饼状图并调整角度使得labelLine和3d的饼状图对齐,并再次setOption// this.option.series.push({// name: 'pie2d',// type: 'pie',// labelLine:{// length:0,// length2:0// },// startAngle: -20 , //起始角度,支持范围[0, 360]。// clockwise: false,//饼图的扇区是否是顺时针排布。上述这两项配置主要是为了对齐3d的样式// radius: ['30%', '60%'],// center: ['10%', '50%'],//没用// data: this.optionData,// itemStyle:{// opacity:0// }// });myChart.setOption(this.option);this.bindListen(myChart);},getPie3D(pieData, internalDiameterRatio) {//internalDiameterRatio:透明的空心占比let that = this;let series = [];let sumValue = 0;let startValue = 0;let endValue = 0;let legendData = [];let legendBfb = [];let k = 1 - internalDiameterRatio;pieData.sort((a, b) => {return (b.value - a.value);});// 为每一个饼图数据,生成一个 series-surface 配置for (let i = 0; i < pieData.length; i++) {sumValue += pieData[i].value;let seriesItem = {name: typeof pieData[i].name === 'undefined' ? `series${i}` : pieData[i].name,value: typeof pieData[i].value === 'undefined' ? `series${i}` : pieData[i].value,pieValue: typeof pieData[i].pieValue === 'undefined' ? `series${i}` : pieData[i].pieValue,height: 10 * (i),type: 'surface',parametric: true,wireframe: {show: false},pieData: pieData[i],pieStatus: {selected: false,hovered: false,k: k},// radius: ['50%', '80%'],// center: ['30%', '50%']};if (typeof pieData[i].itemStyle != 'undefined') {let itemStyle = {};typeof pieData[i].itemStyle.color != 'undefined' ? itemStyle.color = pieData[i].itemStyle.color : null;typeof pieData[i].itemStyle.opacity != 'undefined' ? itemStyle.opacity = pieData[i].itemStyle.opacity : null;seriesItem.itemStyle = itemStyle;}series.push(seriesItem);}// 使用上一次遍历时,计算出的数据和 sumValue,调用 getParametricEquation 函数,// 向每个 series-surface 传入不同的参数方程 series-surface.parametricEquation,也就是实现每一个扇形。legendData = [];legendBfb = [];for (let i = 0; i < series.length; i++) {endValue = startValue + series[i].pieData.value;series[i].pieData.startRatio = startValue / sumValue;series[i].pieData.endRatio = endValue / sumValue;series[i].parametricEquation = this.getParametricEquation(series[i].pieData.startRatio, series[i].pieData.endRatio,false, false, k, series[i].pieData.value);startValue = endValue;let bfb = that.fomatFloat(series[i].pieData.value / sumValue, 4);legendData.push({name: series[i].name,value: bfb,});legendBfb.push({name: series[i].name,value: bfb,value:series[i].value,});}let boxHeight = this.getHeight3D(series, 3);//通过传参设定3d饼/环的高度,26代表26px// 准备待返回的配置项,把准备好的 legendData、series 传入。let option = {// legend: {// data: legendData,// orient: 'scroll',// right: 10,// top: 10,// itemGap: 10,// textStyle: {// color: '#A1E2FF',// },// icon:'roundRect',//图形样式// show: true,// formatter: function(param) {// let item = legendBfb.filter(item => item.name == param)[0];// // let bfs = that.fomatFloat(item.value * 100, 2) + "%";// return `${item.name} ${item.value}`;// }// },labelLine: {show: true,lineStyle: {color: '#7BC0CB'}},tooltip: {formatter: params => {if (params.seriesName !== 'mouseoutSeries' && params.seriesName !== 'pie2d') {// let bfb = ((option.series[params.seriesIndex].pieData.endRatio - option.series[params.seriesIndex].pieData.startRatio) *// 100).toFixed(2);let bfb = option.series[params.seriesIndex].pieValuereturn `${params.seriesName}<br/>` +`<span style="display:inline-block;margin-right:5px;border-radius:10px;width:10px;height:10px;background-color:${params.color};"></span>` +`${ bfb }G`;}}},xAxis3D: {min: -1,max: 1},yAxis3D: {min: -1,max: 1},zAxis3D: {min: -1,max: 1},grid3D: {show: false,boxHeight: boxHeight, //圆环的高度// innerWidth:'100%',top:'-30%',//3d图位置left:'-10%',//3d图位置height:300,//3d图大小viewControl: { //3d效果可以放大、旋转等,请自己去查看官方配置alpha: 30, //角度distance: 400,//调整视角到主体的距离,类似调整zoomrotateSensitivity: 0, //设置为0无法旋转zoomSensitivity: 0, //设置为0无法缩放panSensitivity: 0, //设置为0无法平移autoRotate: false //自动旋转}},series: series,};return option;},//获取3d丙图的最高扇区的高度getHeight3D(series, height) {series.sort((a, b) => {return (b.pieData.value - a.pieData.value);})return height * 30 / series[0].pieData.value;},// 生成扇形的曲面参数方程,用于 series-surface.parametricEquation// h 高度getParametricEquation(startRatio, endRatio, isSelected, isHovered, k, h) {// 计算let midRatio = (startRatio + endRatio) / 2;let startRadian = startRatio * Math.PI * 2;let endRadian = endRatio * Math.PI * 2;let midRadian = midRatio * Math.PI * 2;// 如果只有一个扇形,则不实现选中效果。if (startRatio === 0 && endRatio === 1) {isSelected = false;}// 通过扇形内径/外径的值,换算出辅助参数 k(默认值 1/3)k = typeof k !== 'undefined' ? k : 1 / 3;// 计算选中效果分别在 x 轴、y 轴方向上的位移(未选中,则位移均为 0)let offsetX = isSelected ? Math.cos(midRadian) * 0.1 : 0;let offsetY = isSelected ? Math.sin(midRadian) * 0.1 : 0;// 计算高亮效果的放大比例(未高亮,则比例为 1)let hoverRate = isHovered ? 1.05 : 1;// 返回曲面参数方程return {u: {min: -Math.PI,max: Math.PI * 3,step: Math.PI / 32},v: {min: 0,max: Math.PI * 2,step: Math.PI / 20},x: function(u, v) {if (u < startRadian) {return offsetX + Math.cos(startRadian) * (1 + Math.cos(v) * k) * hoverRate;}if (u > endRadian) {return offsetX + Math.cos(endRadian) * (1 + Math.cos(v) * k) * hoverRate;}return offsetX + Math.cos(u) * (1 + Math.cos(v) * k) * hoverRate;},y: function(u, v) {if (u < startRadian) {return offsetY + Math.sin(startRadian) * (1 + Math.cos(v) * k) * hoverRate;}if (u > endRadian) {return offsetY + Math.sin(endRadian) * (1 + Math.cos(v) * k) * hoverRate;}return offsetY + Math.sin(u) * (1 + Math.cos(v) * k) * hoverRate;},z: function(u, v) {if (u < -Math.PI * 0.5) {return Math.sin(u);}if (u > Math.PI * 2.5) {return Math.sin(u) * h * .1;}return Math.sin(v) > 0 ? 1 * h * .5 : -1;}};},fomatFloat(num, n) {var f = parseFloat(num);if (isNaN(f)) {return false;}f = Math.round(num * Math.pow(10, n)) / Math.pow(10, n); // n 幂 var s = f.toString();var rs = s.indexOf('.');//判定如果是整数,增加小数点再补0if (rs < 0) {rs = s.length;s += '.';}while (s.length <= rs + n) {s += '0';}return s;},bindListen(myChart) {// 监听鼠标事件,实现饼图选中效果(单选),近似实现高亮(放大)效果。let that = this;let selectedIndex = '';let hoveredIndex = '';// 监听点击事件,实现选中效果(单选)myChart.on('click', function(params) {// 从 option.series 中读取重新渲染扇形所需的参数,将是否选中取反。let isSelected = !that.option.series[params.seriesIndex].pieStatus.selected;let isHovered = that.option.series[params.seriesIndex].pieStatus.hovered;let k = that.option.series[params.seriesIndex].pieStatus.k;let startRatio = that.option.series[params.seriesIndex].pieData.startRatio;let endRatio = that.option.series[params.seriesIndex].pieData.endRatio;// 如果之前选中过其他扇形,将其取消选中(对 option 更新)if (selectedIndex !== '' && selectedIndex !== params.seriesIndex) {that.option.series[selectedIndex].parametricEquation = that.getParametricEquation(that.option.series[selectedIndex].pieData.startRatio, that.option.series[selectedIndex].pieData.endRatio, false, false, k, that.option.series[selectedIndex].pieData.value);that.option.series[selectedIndex].pieStatus.selected = false;}// 对当前点击的扇形,执行选中/取消选中操作(对 option 更新)that.option.series[params.seriesIndex].parametricEquation = that.getParametricEquation(startRatio, endRatio,isSelected,isHovered, k, that.option.series[params.seriesIndex].pieData.value);that.option.series[params.seriesIndex].pieStatus.selected = isSelected;// 如果本次是选中操作,记录上次选中的扇形对应的系列号 seriesIndexisSelected ? selectedIndex = params.seriesIndex : null;// 使用更新后的 option,渲染图表myChart.setOption(that.option);});// 监听 mouseover,近似实现高亮(放大)效果myChart.on('mouseover', function(params) {// 准备重新渲染扇形所需的参数let isSelected;let isHovered;let startRatio;let endRatio;let k;// 如果触发 mouseover 的扇形当前已高亮,则不做操作if (hoveredIndex === params.seriesIndex) {return;// 否则进行高亮及必要的取消高亮操作} else {// 如果当前有高亮的扇形,取消其高亮状态(对 option 更新)if (hoveredIndex !== '') {// 从 option.series 中读取重新渲染扇形所需的参数,将是否高亮设置为 false。isSelected = that.option.series[hoveredIndex].pieStatus.selected;isHovered = false;startRatio = that.option.series[hoveredIndex].pieData.startRatio;endRatio = that.option.series[hoveredIndex].pieData.endRatio;k = that.option.series[hoveredIndex].pieStatus.k;// 对当前点击的扇形,执行取消高亮操作(对 option 更新)that.option.series[hoveredIndex].parametricEquation = that.getParametricEquation(startRatio, endRatio,isSelected,isHovered, k, that.option.series[hoveredIndex].pieData.value);that.option.series[hoveredIndex].pieStatus.hovered = isHovered;// 将此前记录的上次选中的扇形对应的系列号 seriesIndex 清空hoveredIndex = '';}// 如果触发 mouseover 的扇形不是透明圆环,将其高亮(对 option 更新)if (params.seriesName !== 'mouseoutSeries' && params.seriesName !== 'pie2d') {// 从 option.series 中读取重新渲染扇形所需的参数,将是否高亮设置为 true。isSelected = that.option.series[params.seriesIndex].pieStatus.selected;isHovered = true;startRatio = that.option.series[params.seriesIndex].pieData.startRatio;endRatio = that.option.series[params.seriesIndex].pieData.endRatio;k = that.option.series[params.seriesIndex].pieStatus.k;// 对当前点击的扇形,执行高亮操作(对 option 更新)that.option.series[params.seriesIndex].parametricEquation = that.getParametricEquation(startRatio, endRatio,isSelected, isHovered, k, that.option.series[params.seriesIndex].pieData.value + 5);that.option.series[params.seriesIndex].pieStatus.hovered = isHovered;// 记录上次高亮的扇形对应的系列号 seriesIndexhoveredIndex = params.seriesIndex;}// 使用更新后的 option,渲染图表myChart.setOption(that.option);}});// 修正取消高亮失败的 bugmyChart.on('globalout', function() {// 准备重新渲染扇形所需的参数let isSelected;let isHovered;let startRatio;let endRatio;let k;if (hoveredIndex !== '') {// 从 option.series 中读取重新渲染扇形所需的参数,将是否高亮设置为 true。isSelected = that.option.series[hoveredIndex].pieStatus.selected;isHovered = false;k = that.option.series[hoveredIndex].pieStatus.k;startRatio = that.option.series[hoveredIndex].pieData.startRatio;endRatio = that.option.series[hoveredIndex].pieData.endRatio;// 对当前点击的扇形,执行取消高亮操作(对 option 更新)that.option.series[hoveredIndex].parametricEquation = that.getParametricEquation(startRatio, endRatio,isSelected,isHovered, k, that.option.series[hoveredIndex].pieData.value);that.option.series[hoveredIndex].pieStatus.hovered = isHovered;// 将此前记录的上次选中的扇形对应的系列号 seriesIndex 清空hoveredIndex = '';}// 使用更新后的 option,渲染图表myChart.setOption(that.option);});}},}</script><!-- Add "scoped" attribute to limit CSS to this component only --><style scoped lang="scss">.cointan{// width: 450px;// height: 302px;width: 100%;height: 100%;// background-image: url('../assets/index/litterbackground.png');background-size: 100%;}.title1{position: absolute;margin: 9px 0 0 10px;font-size: 20px;font-family : '优设标题黑';color: rgba(255, 255, 255, 1);font-weight: 400;}// 3d环形图.chart{position: absolute;width: 100%;height: 300px;// margin: 90px 0 0 30px;// width: 370px;// height: 400px;}.huannum{position: absolute;margin: 141px 0 0 40px;width: 205px;text-align: center;font-size: 24px;font-weight: 700;line-height: 35.52px;color: rgba(255, 255, 255, 1);}.huantxt{position: absolute;margin: 171px 0 0 120px;font-size: 12px;font-weight: 400;line-height: 17.76px;color: rgba(168, 214, 255, 1);}#cityGreenLand-charts{background: url(@/assets/marsServerMonitor/disk-bg.png) no-repeat;background-size: 37% 50%;background-position: 34% 10px}</style>传数据和更新组件写法
引入组件
import charts3DPie from '../components/charts3DPie'组件绑定ref
<charts3DPie ref="chartPie"> </charts3DPie>对数据传输、更新数据
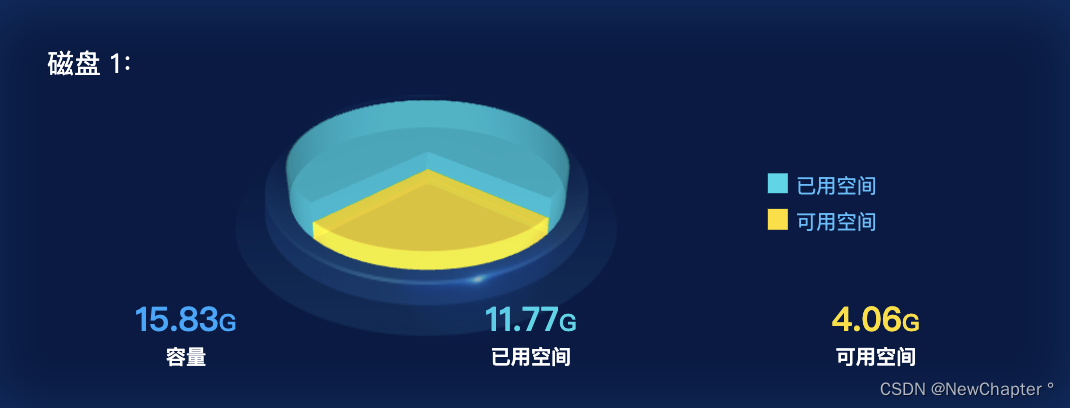
let optionData = that.$refs.chartPie.optionData || []optionData.forEach(item => {if (item.name == '可用空间') {item.value = parseInt(that.serverData.diskUnused)item.pieValue = that.serverData.diskUnused} else {//已用空间item.value = parseInt(that.serverData.diskAlready)item.pieValue = that.serverData.diskAlready}})that.$refs.chartPie.optionData = optionData效果


![[Tcpdump] 网络抓包工具使用教程](https://img-blog.csdnimg.cn/direct/2084f53697f643ac97b804b843b1885e.png)