目录
绘图技巧篇
绘图代码篇
免费完整代码获取
今天为大家带来一期18种Matlab绘图代码与20个绘图技巧代码,所有代码完全免费!
如果你想发SCI,普通的图已经进入不了审稿人的视线了,非常容易被拒稿。试想,如果一篇乱七八糟丑不拉几的文章放在你的面前,你还会给它Accept吗?因此,本期免费给大家带来你必须要学会的18种Matlab绘图代码与20个绘图技巧!
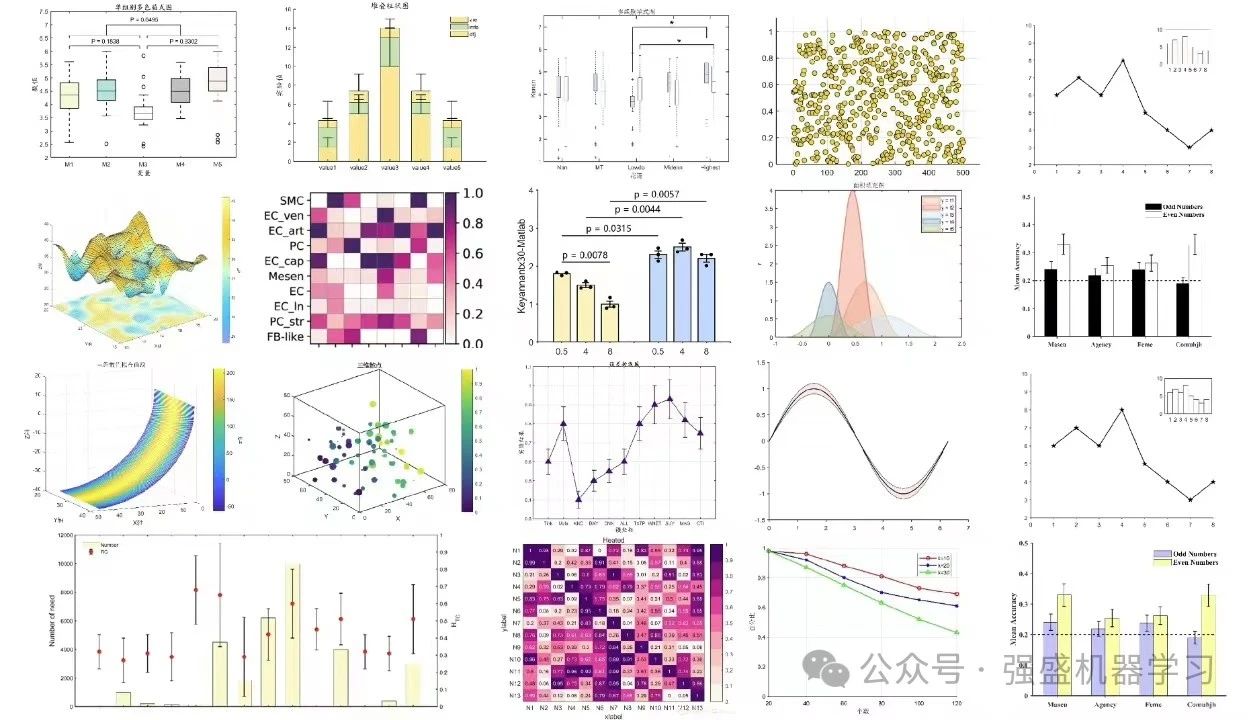
共包含单组箱式图、堆叠柱状图、对数坐标图、多组箱式图、二维散点图、进阶热力图、进阶柱状图、面积填充图、普通热力图、普通折线图、曲面映射图、三维面积图、三维曲面拟合图、三维散点图、实用柱状图、双Y轴组合图、误差折线图、小窗图:折线图+柱状图18种,可完全满足您的需求,包括复现SCI顶刊热力图!
绘图技巧篇
先看下目录:
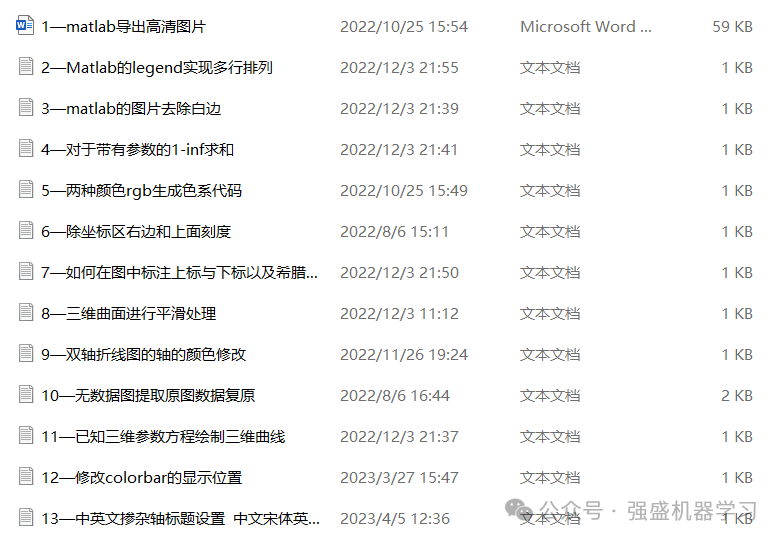
由于字数和时间原因,这边就不全放出来了,挑几个技巧给大家看一下,剩下的都已经放文件夹里自行提取即可~
技巧1:Matlab导出高清图片
方法一:借助matlab交互页面导出
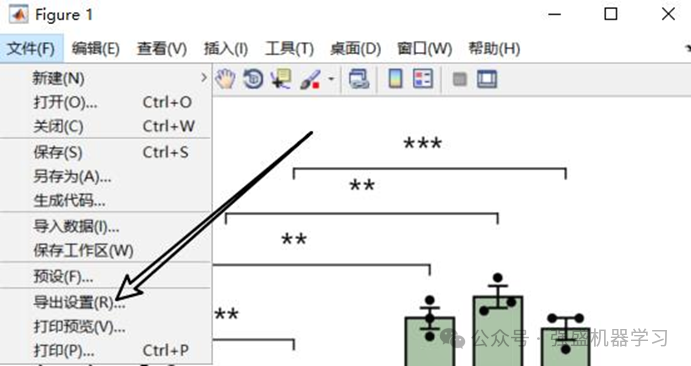
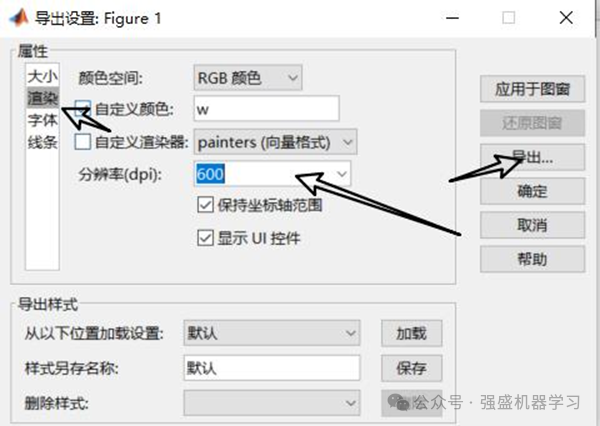
方法二:借助MATLAB的print函数
print(gcf, 'test.png','-r300','-dpng');其中可以自行设置dpi为300、600、900、1200
格式可以自行设置
技巧2:Matlab的legend实现多行排列
第一种方法:
legend({'cos(x)','cos(2x)','cos(3x)','cos(4x)'},'Location','northwest','NumColumns',2)第二种方法:建立两个lgd
lgd1 = legend([h1 h2],.........);
ah = axes('position',get(gca,'position'),'visible','off');
lgd2 = legend(ah,[h3 h4],............);
set(lgd2,.......)
技巧3:Matlab的图片去除白边
方法1:
set(gca, 'LooseInset', [0,0,0,0]);方法2:
set(gca, 'Position', get(gca, 'OuterPosition') - ...
get(gca, 'TightInset') * [-1 0 1 0; 0 -1 0 1; 0 0 1 0; 0 0 0 1]);
技巧4:获取subplot子图位置,自己定义位置
h1  = subplot(9,11,1)
get(h1,'position')
结果:【20 40 300 600】
绘图的时候进行修改位置
subplot(2,3,1,'Position',[        ]);
%前面两个数值分别代表子图离左边框和下边框的距离,后面两个数值是子图的长和宽
技巧5:中英文掺杂轴标题设置 中文宋体英文新罗马设置
绘图代码篇
先看下目录:
共包含单组箱式图、堆叠柱状图、对数坐标图、多组箱式图、二维散点图、进阶热力图、进阶柱状图、面积填充图、普通热力图、普通折线图、曲面映射图、三维面积图、三维曲面拟合图、三维散点图、实用柱状图、双Y轴组合图、误差折线图、小窗图:折线图+柱状图18种,可完全满足您的需求
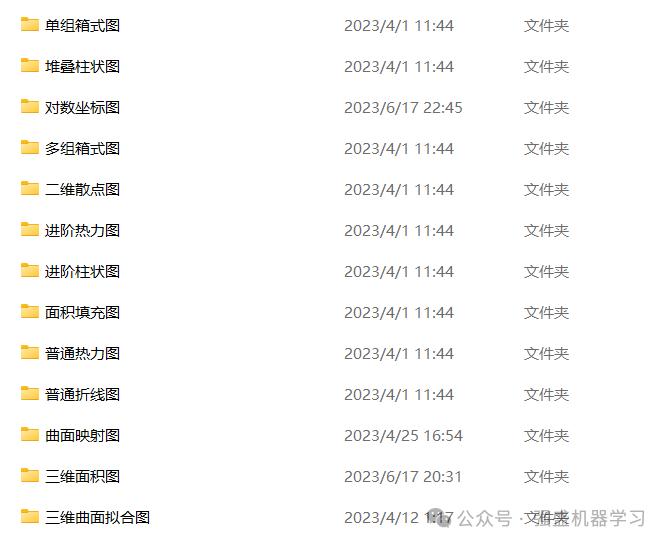
同样,由于字数和时间原因,这边就不全放出来了,挑几个代码给大家看一下,剩下的都已经放文件夹里自行提取即可~
绘图代码1:堆叠柱状图
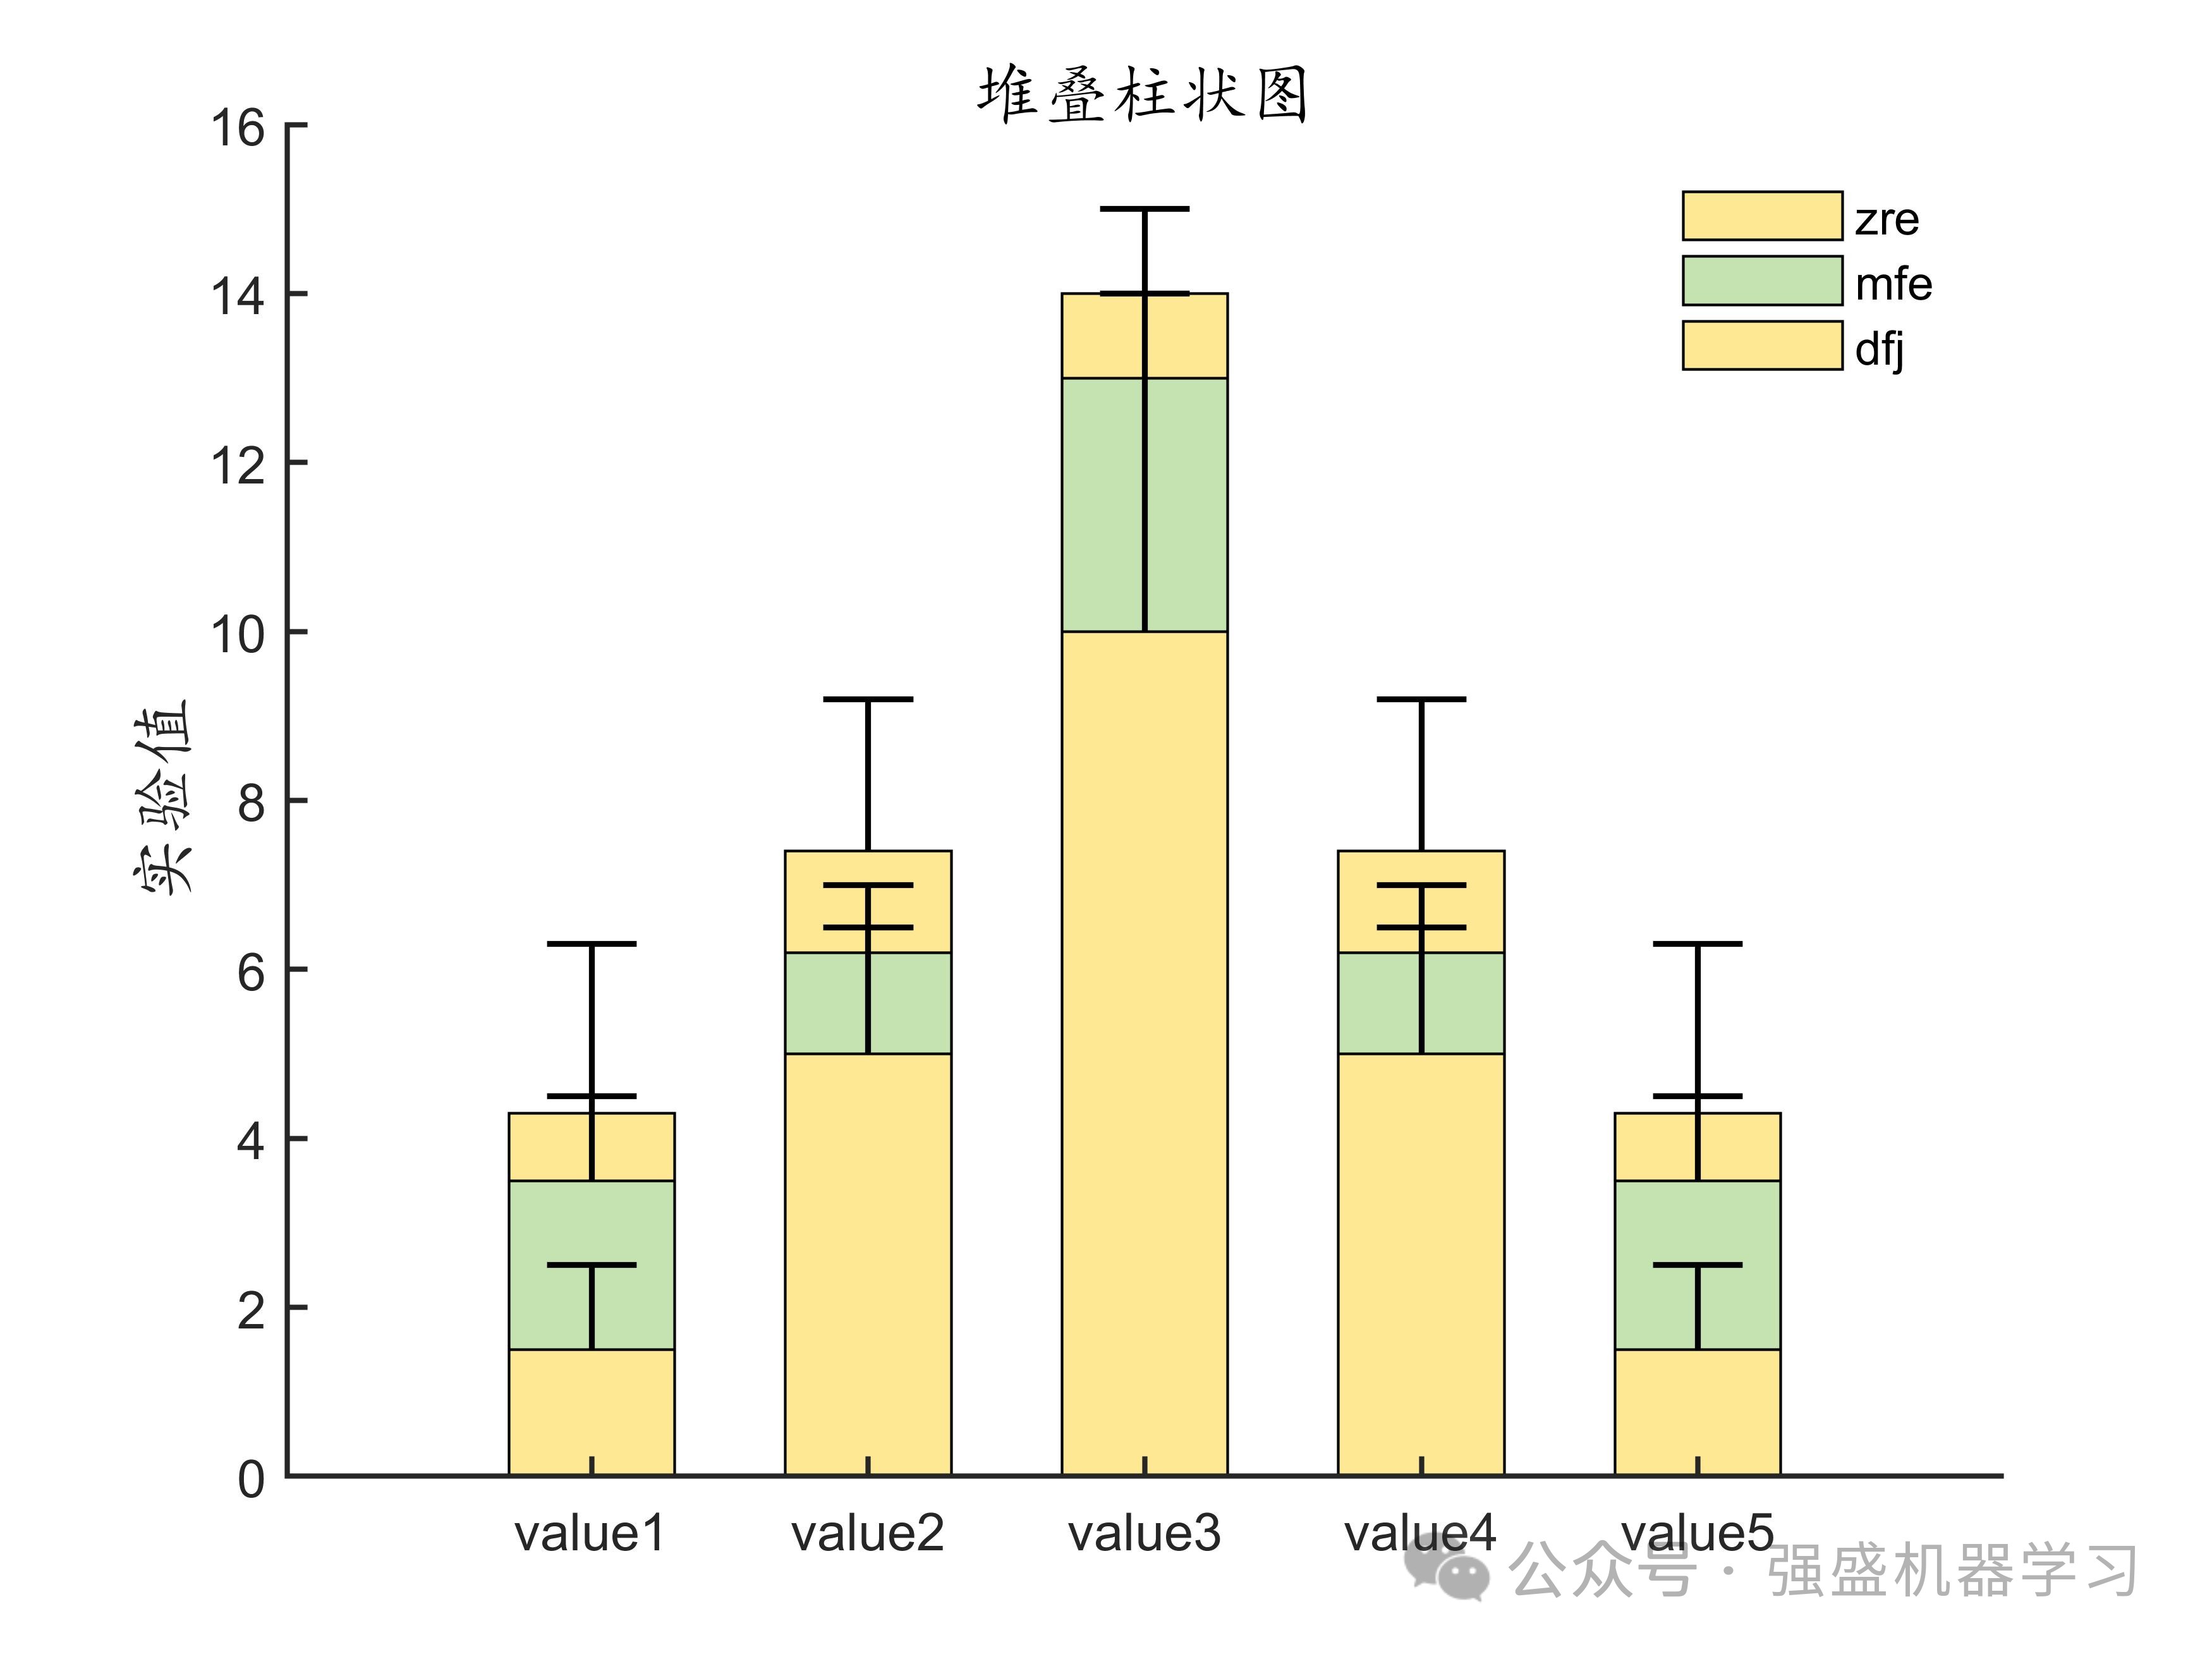
%% 数据准备
data = [1.5,2,0.8;...5,1.2,1.2;...10,3,1;...5,1.2,1.2;...1.5,2,0.8];
error_data = [1,1,2;...2,0.3,1.8;...5,1,1;...2,0.3,1.8;...1,1,2];
%% 开始绘图
figure('color',[1 1 1]);
bar_figure = bar(data,0.6,'stacked');
hold on;
errorbar([],[cumsum(data')]',[],error_data,'LineStyle','none',...'Color',[0 0 0],'Linewidth',1.1,'CapSize',17);
%% 设置颜色
C1 = [244 206 125]./255;
C2= [123 160 176]./255;
color1 = C1;
color2 =C2;
color3 = C1;
Color = [color1;color2 ;color3];
for i = 1:size(Color,1)bar_figure(i).FaceColor = Color(i,:);
end
%% 设置坐标区参数
xlabel_str = {'value1','value2','value3','value4','value5'};
ylabel('实验值','Fontsize',13,'Fontname','楷体');
title('堆叠柱状图','Fontsize',13,'Fontname','楷体');
set(gca,'YTick',0:2:16,'Ylim',[0 16]);
set(gca,'Xticklabel',xlabel_str);
set(gca,'box','off');
h = legend('zre','mfe','dfj');
set(h,'box','off');
set(gca,'Linewidth',1);绘图代码2:多组箱式图
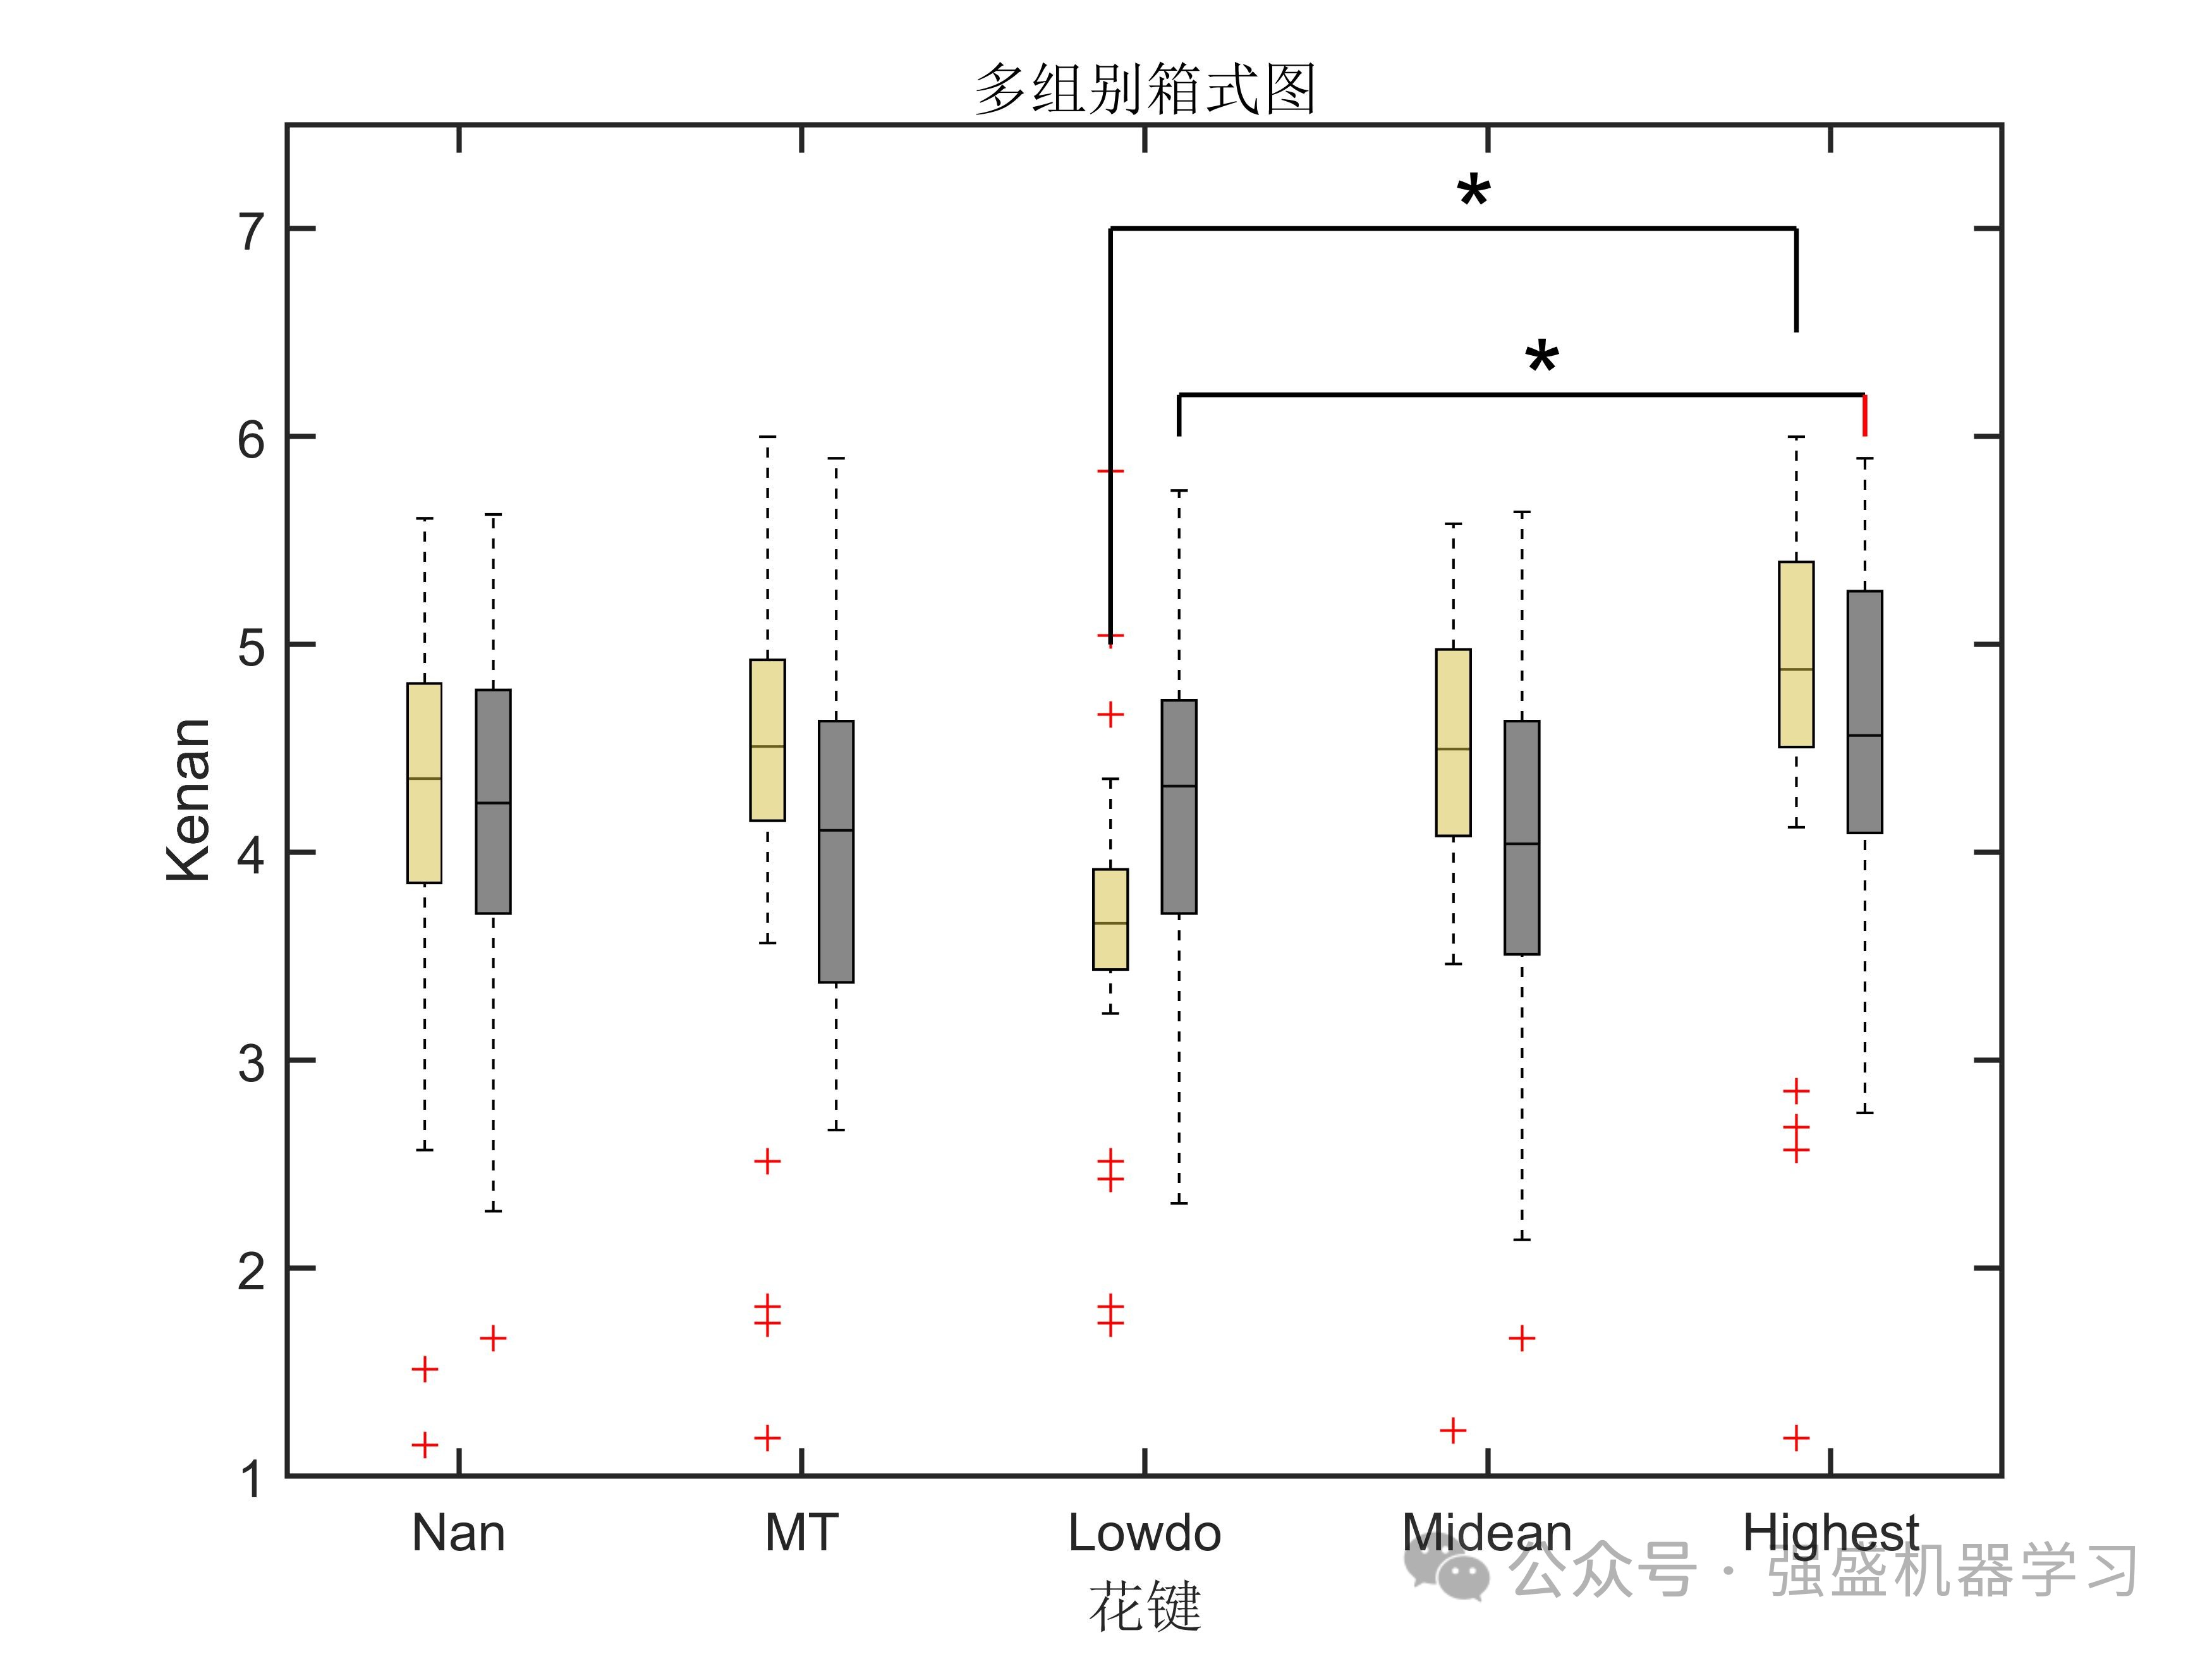
%% 导入数据
clc;
clear;
[all,abc,str] = xlsread('data2.xlsx');
%% edge color
data1=all(:,1:5);
data2=all(:,7:11);
edgecolor1=[0,0,0]; % black color
edgecolor2=[0,0,0]; % black color
fillcolor1=[206, 85, 30]/255; % fillcolors = rand(24, 3);
fillcolor2=[46, 114, 188]/255;
fillcolors=[repmat(fillcolor1,5,1);repmat(fillcolor2,5,1)];
position_1 = [0.8:2:8.8]; % define position for first group boxplot
position_2 = [1.2:2:9.2]; % define position for second group boxplot
box_1 = boxplot(data1,'positions',position_1,'colors',edgecolor1,'width',0.2,'symbol','r+','outliersize',5);
hold on;
box_2 = boxplot(data2,'positions',position_2,'colors',edgecolor2,'width',0.2,'symbol','r+','outliersize',5);
boxobj = findobj(gca,'Tag','Box');
for j=1:length(boxobj)patch(get(boxobj(j),'XData'),get(boxobj(j),'YData'),fillcolors(j,:),'FaceAlpha',0.5);
end
set(gca,'XTick', [1 3 5 7 9],'Xlim',[0 10]);
set(gca,'YTick',1:1:7.5,...'Ylim',[1 7.5]);
boxchi = get(gca, 'Children');
xticks([1 3 5 7 9]);
xticklabels({'Nan','MT','Lowdo','Midean','Highest'});
hold on;
x13 = 4.8;
y13 = 5;
x15 = 8.8;
y15 = 6.5;
plot([x13,x13],[y13,7],'b','Linewidth',0.9);
hold on;
plot([x13,x15],[7,7],'b','Linewidth',0.9);
hold on;
plot([x15,x15],[y15,7],'b','Linewidth',0.9);
text((x15+x13)/2,7.1,'*','fontsize',20);
x23 = 5.2;
y23 = 6;
x25 = 9.2;
y25 = 6;
plot([x23,x23],[y23,6.2],'r','Linewidth',0.9);
hold on;
plot([x23,x25],[6.2,6.2],'r','Linewidth',0.9);
hold on;
plot([x25,x25],[y25,6.2],'r','Linewidth',0.9);
hold on;
text((x25+x23)/2,6.3,'*','fontsize',20);
%% 设置边框
% 坐标轴美化
set(gca, 'Box', 'on', ... % 边框'LineWidth', 1,... % 线宽'XGrid', 'off', 'YGrid', 'off', ... % 网格'TickDir', 'in', 'TickLength', [.015 .015], ... % 刻度'XMinorTick', 'off', 'YMinorTick', 'off')
% 字体和字号
set(gca, 'FontSize', 10)
% 背景颜色
set(gcf,'Color',[1 1 1])
% 设置图例
xlabel('花键');
ylabel('Kenan');
title('多组别箱式图');
%图例设置
% legend([boxchi(1),boxchi(6)], ["Fuzzing", "Uniform"] );
%% 保存图片
savefig(gcf,'boxplot_position_fillcolor.fig');
print(gcf,'result','-dpng','-r600');绘图代码3:多组箱式图
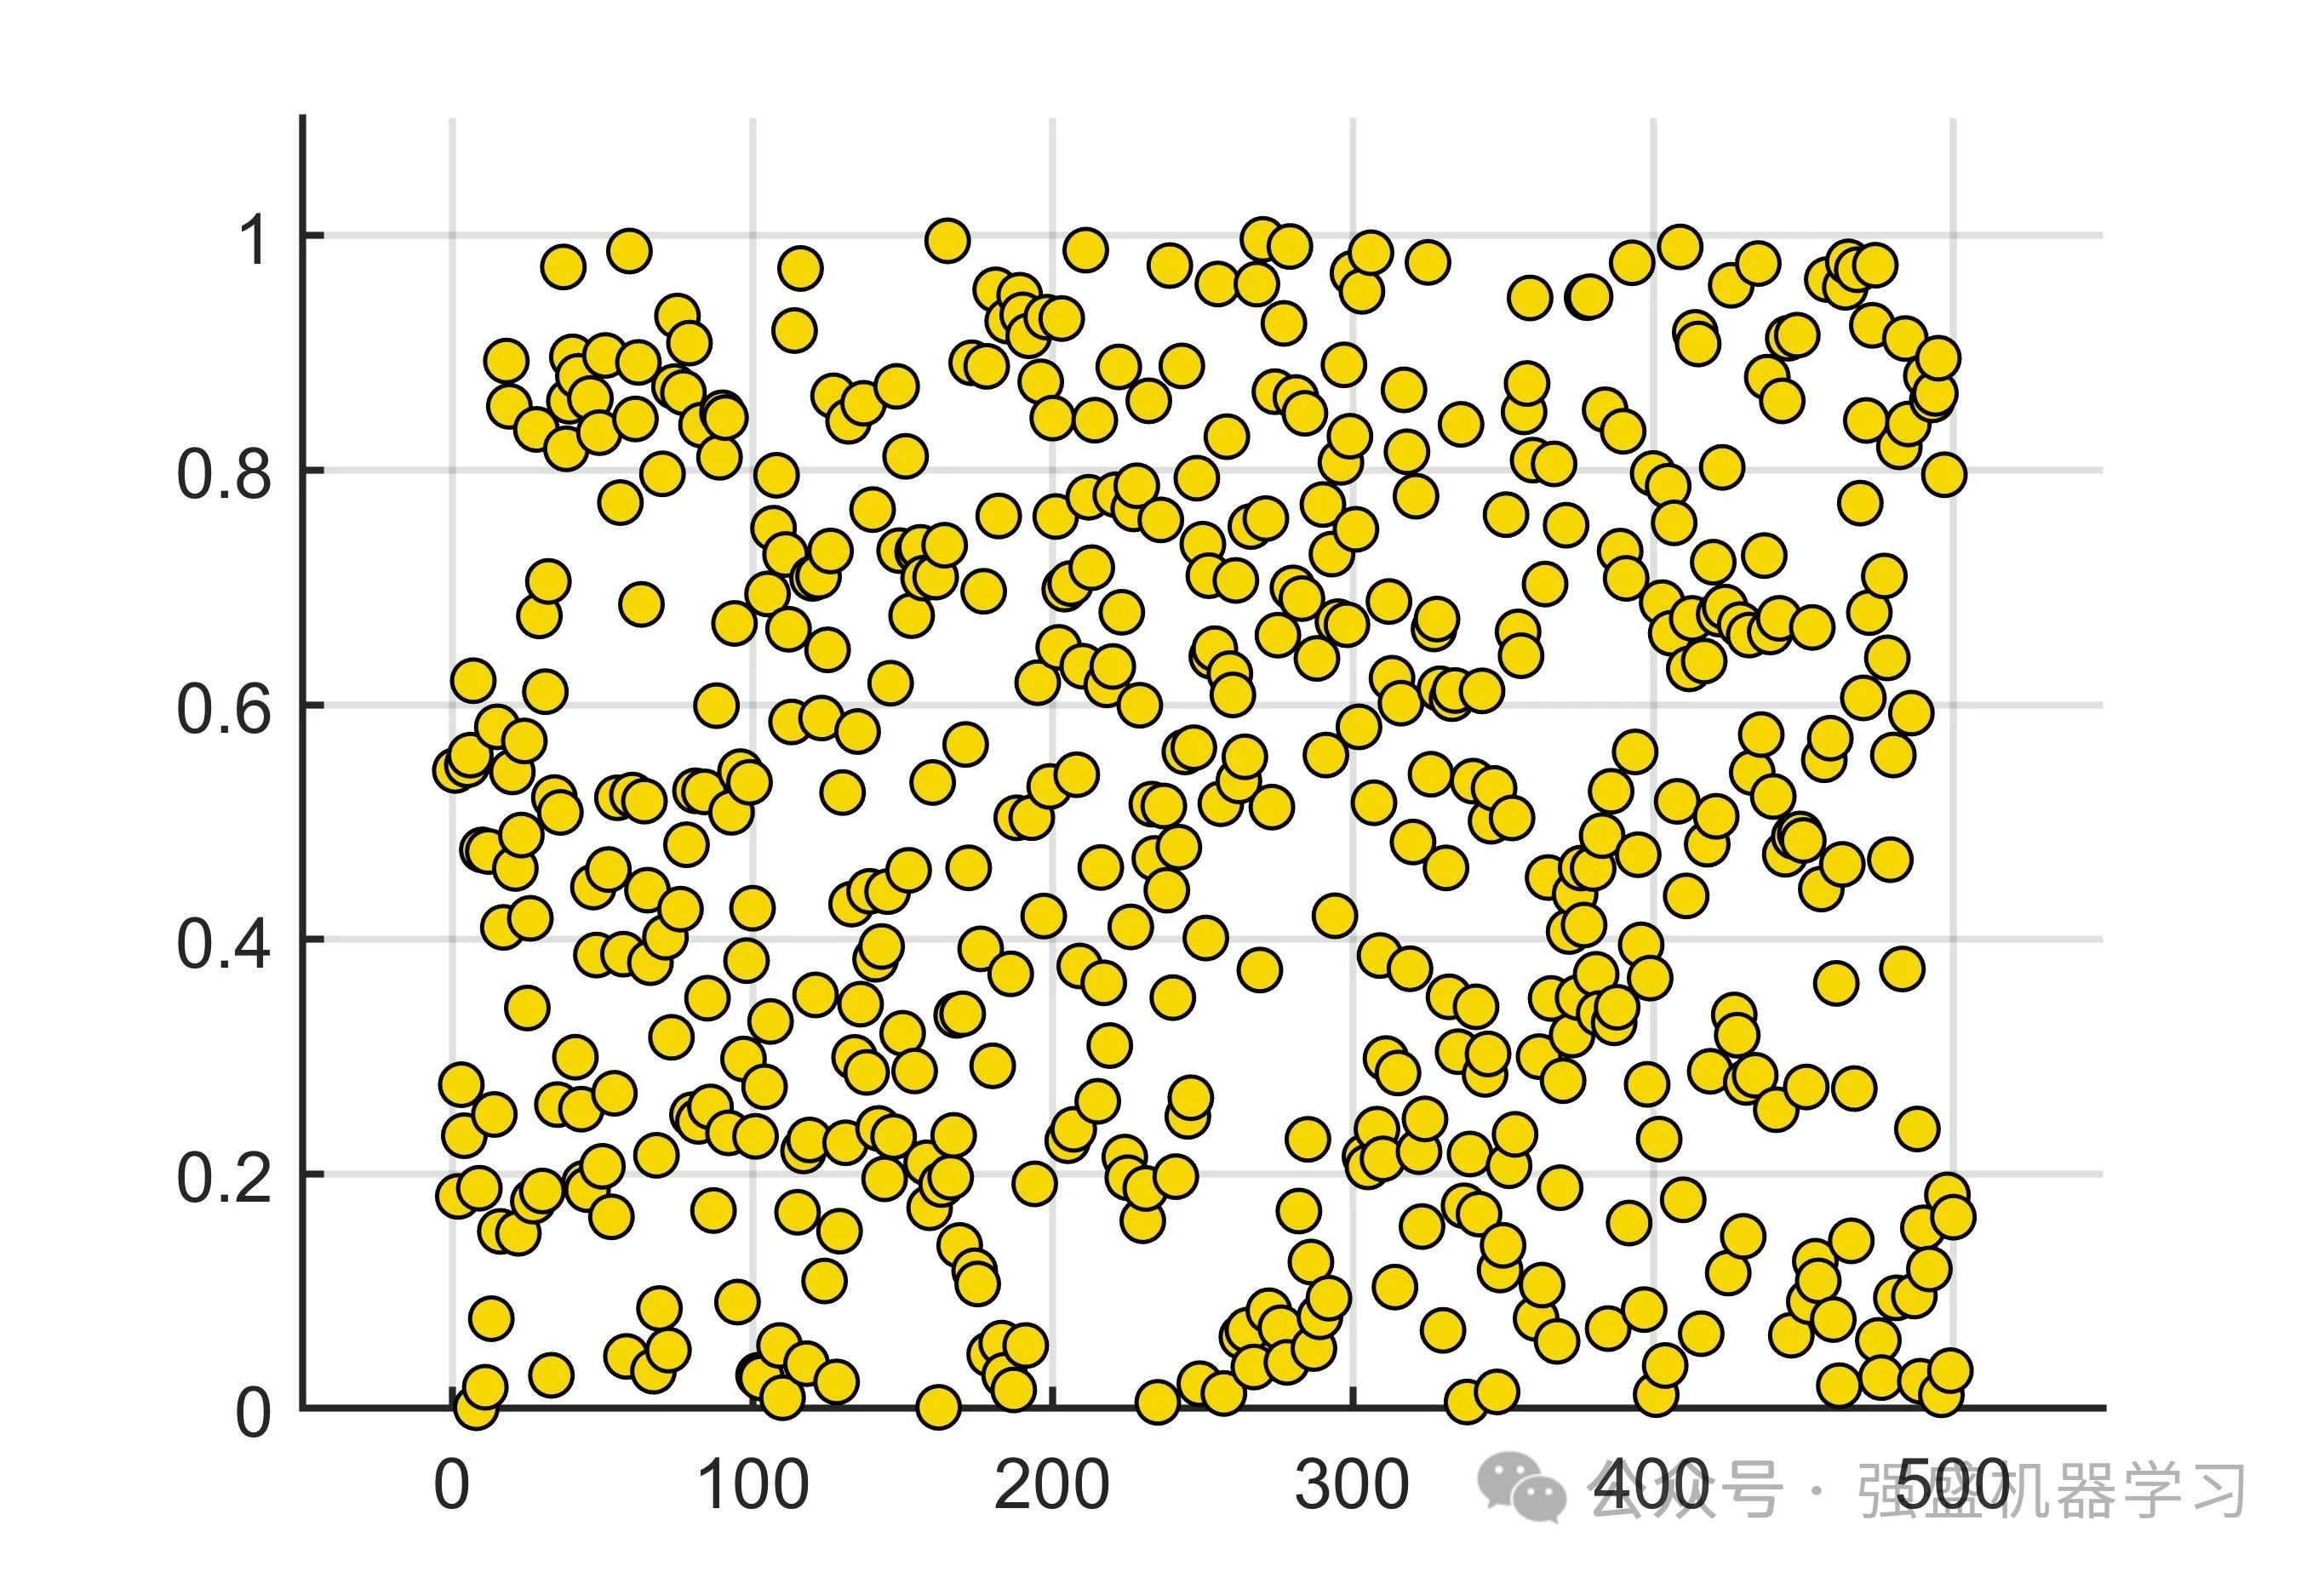
%% 二维散点图教程绘制
%% 数据准备
clc
clear;
%生成500个0-1之间的数据
x = 100:600;
a= 0;
b=1;
R = a + (b-a).*rand(500,1);
m =R;
%% 开始绘图
figure('color',[1 1 1]);
s = scatter(1:length(m),m,'filled');
s.LineWidth = 0.6;
kk = rand(1,500)';
s.AlphaData = kk;
s.MarkerFaceAlpha = 'flat';
s.MarkerEdgeColor = 'k';
c1 = [246 214 3]/255;
c2 = [9 12 19]/255;
c3 = [254 114 141]/255;
c4 = [128 159 186]/255;
s.MarkerFaceColor = c1;
s.MarkerFaceColor = c2;
s.MarkerFaceColor = c3;
s.MarkerFaceColor = c4;
set(gca,'Xlim',[-50 550]);
set(gca,'Ylim',[0,1.1]);
set(gca,'Linewidth',1);
grid on;绘图代码4:面积填充图
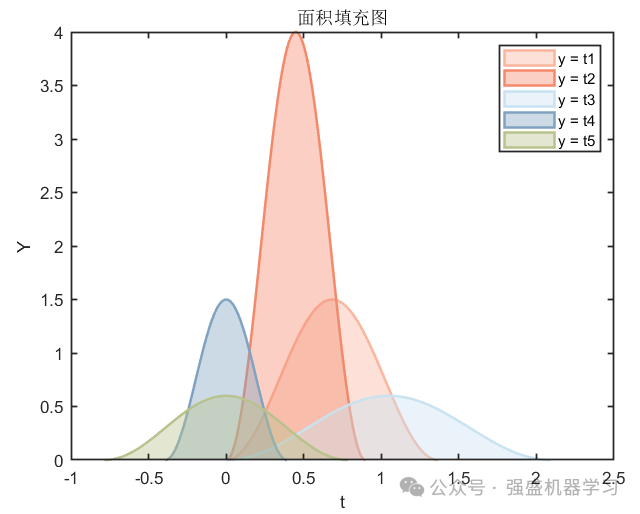
%% 导入数据文件
clc;
clear;
load t.mat;%矩阵大小5*2095
load Y.mat;%矩阵大小5*2095
% 5对应曲线数量、2095是大家自己的数据点
%% 导入配色文件
mycolor = [0.980392156862745,0.709803921568628,0.615686274509804;...0.956862745098039,0.533333333333333,0.415686274509804;...0.788235294117647,0.886274509803922,0.941176470588235;...0.501960784313726,0.635294117647059,0.752941176470588;...0.721568627450980,0.760784313725490,0.549019607843137];
%% 开始绘图 所用函数为area
figure('color',[ 1 1 1]);
% 参数设置主要为线宽、面积颜色、阴影系数
for i = 1:size(t,1)% size函数读取数据矩阵行数area(t(i,:),Y(i,:),'Linewidth',1.5,'FaceColor',mycolor(i,:),'EdgeColor',mycolor(i,:),'FaceAlpha',0.4);hold on;
end
%% 添加图例与轴标题
xlabel('t');
ylabel('Y');
title('面积填充图');
legend('y = t1','y = t2','y = t3','y = t4','y = t5');
set(gca,'Linewidth',1);
% 简单好看的面积图就可以保存啦
绘图代码5:三维面积图
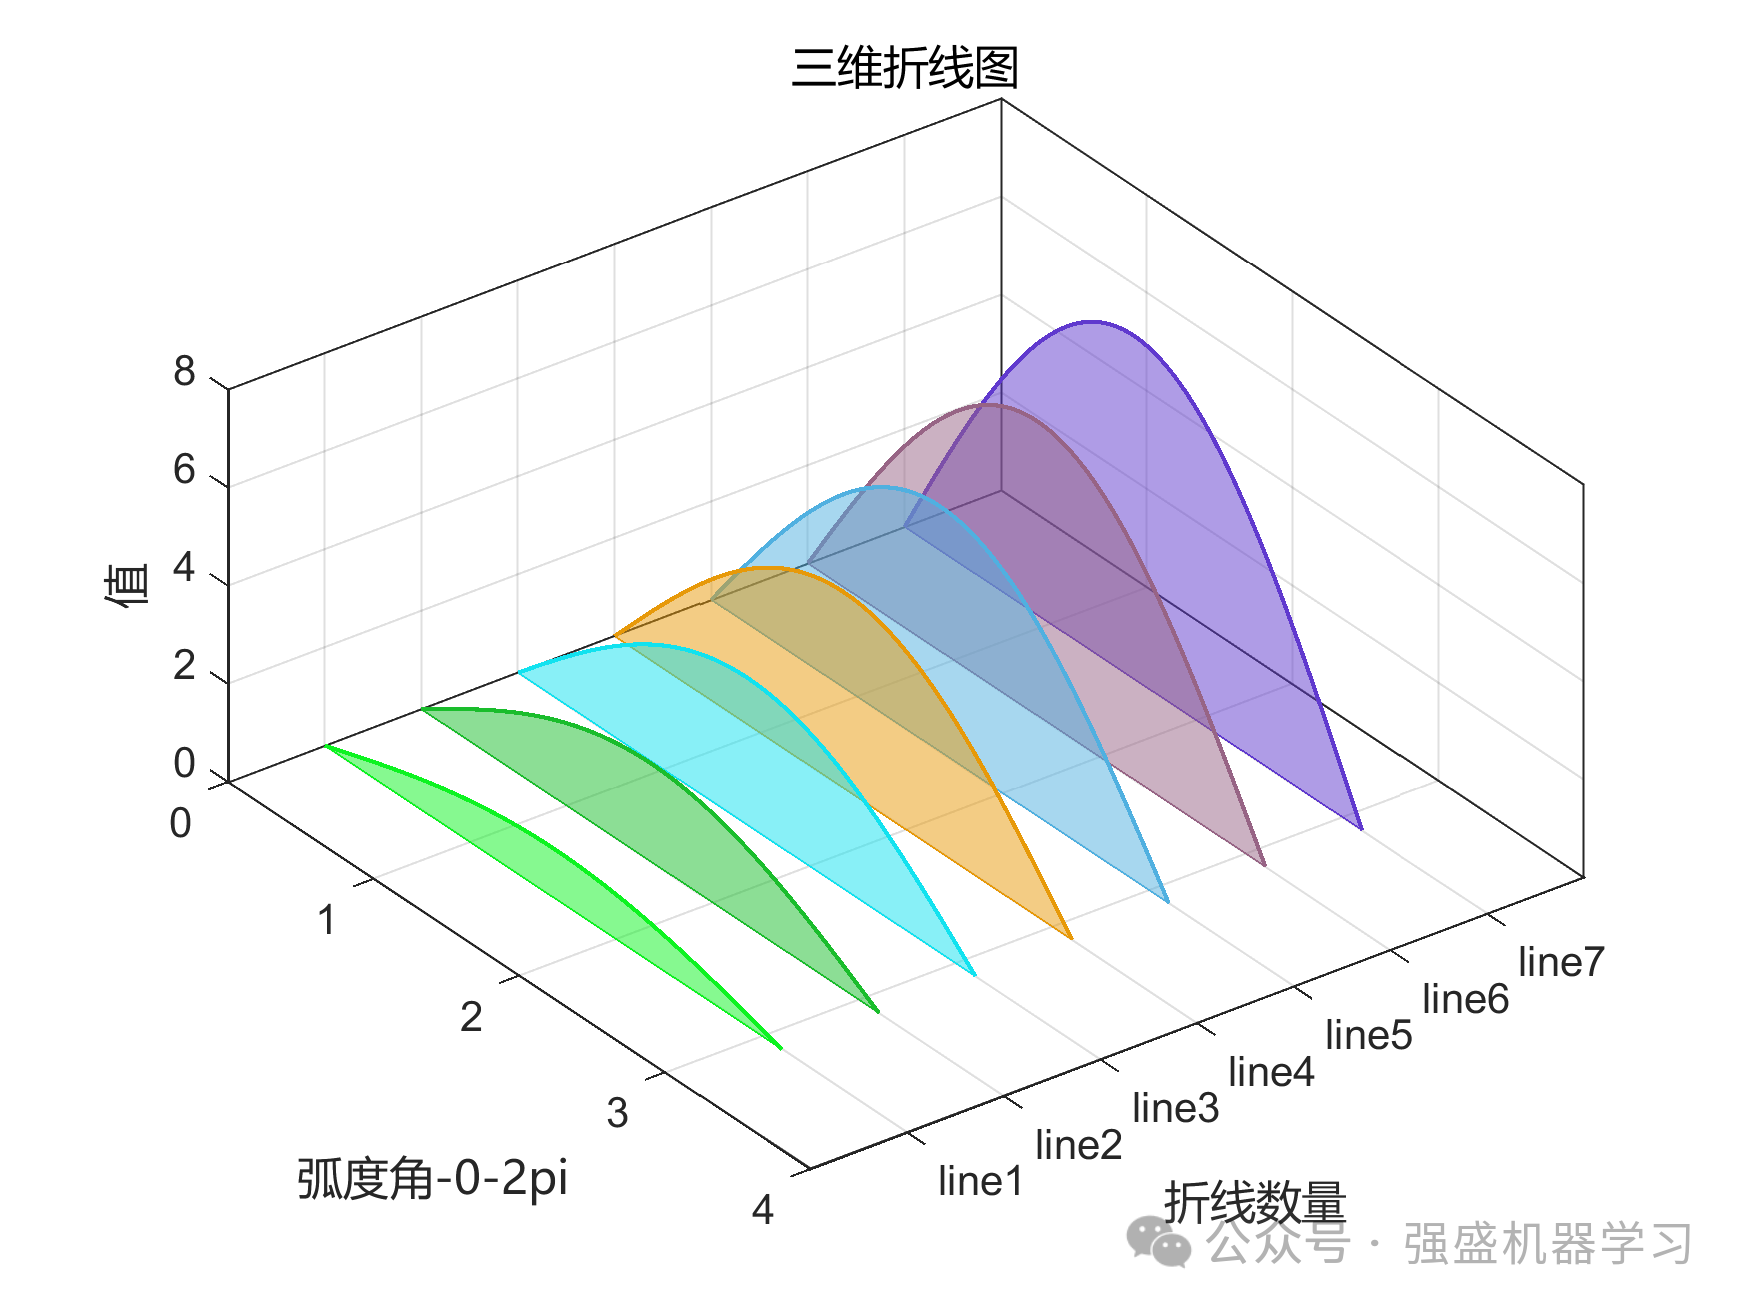
%% 绘制三维折线图并且进行填充设置
clc;
clear;
% 首先说一下数据格式的组成
% X:数据X是自变量 就是你的时间序列的自变量时间 一个行向量
% Y: 数据Y也是一个自变量 有几个线就有几行,列向量是数据点个数 假如一根线 第一行全是1 两根线就是第一行全是1 第二行全是2
% 三行的话数据第三行就全是3, 这个例子是5根线
% Z: Z数据就是你的时间序列对应的值,行数也是线的数量。这个例子是5根线
num_line = 7;
X = 0:0.01:pi;
y = ones(1,size(X,2));
Y = [];
for i = 1:num_lineY(i,:) = y.*i;
end
Z = [];
for i = 1:num_lineZ(i,:) = i.*sin(X);
end
% 随机设置颜色
colorall=rand(num_line,3);
% 这是5根线的颜色
% 这下面是绘图代码 先画线 后填充
% 绘制折线图
for i=1:size(Z,1)plot3(X,Y(i,:),Z(i,:),'LineWidth',1,'Color',colorall(i,:));hold on;fill3(X,Y(i,:),Z(i,:),colorall(i,:),'FaceAlpha',0.5,'EdgeColor',colorall(i,:))
end
view(53,51);
% 下面是修改图窗属性
set(gcf,'color','w');
set(gca,'Box','on');
set(gca,'Xgrid','on','Ygrid','on','Zgrid','on');
xlabel('弧度角-0-2pi','Fontname','微软雅黑');
ylabel('折线数量','Fontname','微软雅黑');
zlabel('值','Fontname','微软雅黑');
title('三维折线图','Fontname','微软雅黑');
% 这是修改Y轴的标签 每个线的名字
cell_str = {};
for j = 1:num_linecell_str{j} = ['line',num2str(j)];
end
set(gca,'Ylim',[0 num_line+1],'Ytick', [1:1:num_line], 'Yticklabel',cell_str);
print(gcf,'图','-dpng','-r300');绘图代码6:双Y轴组合图
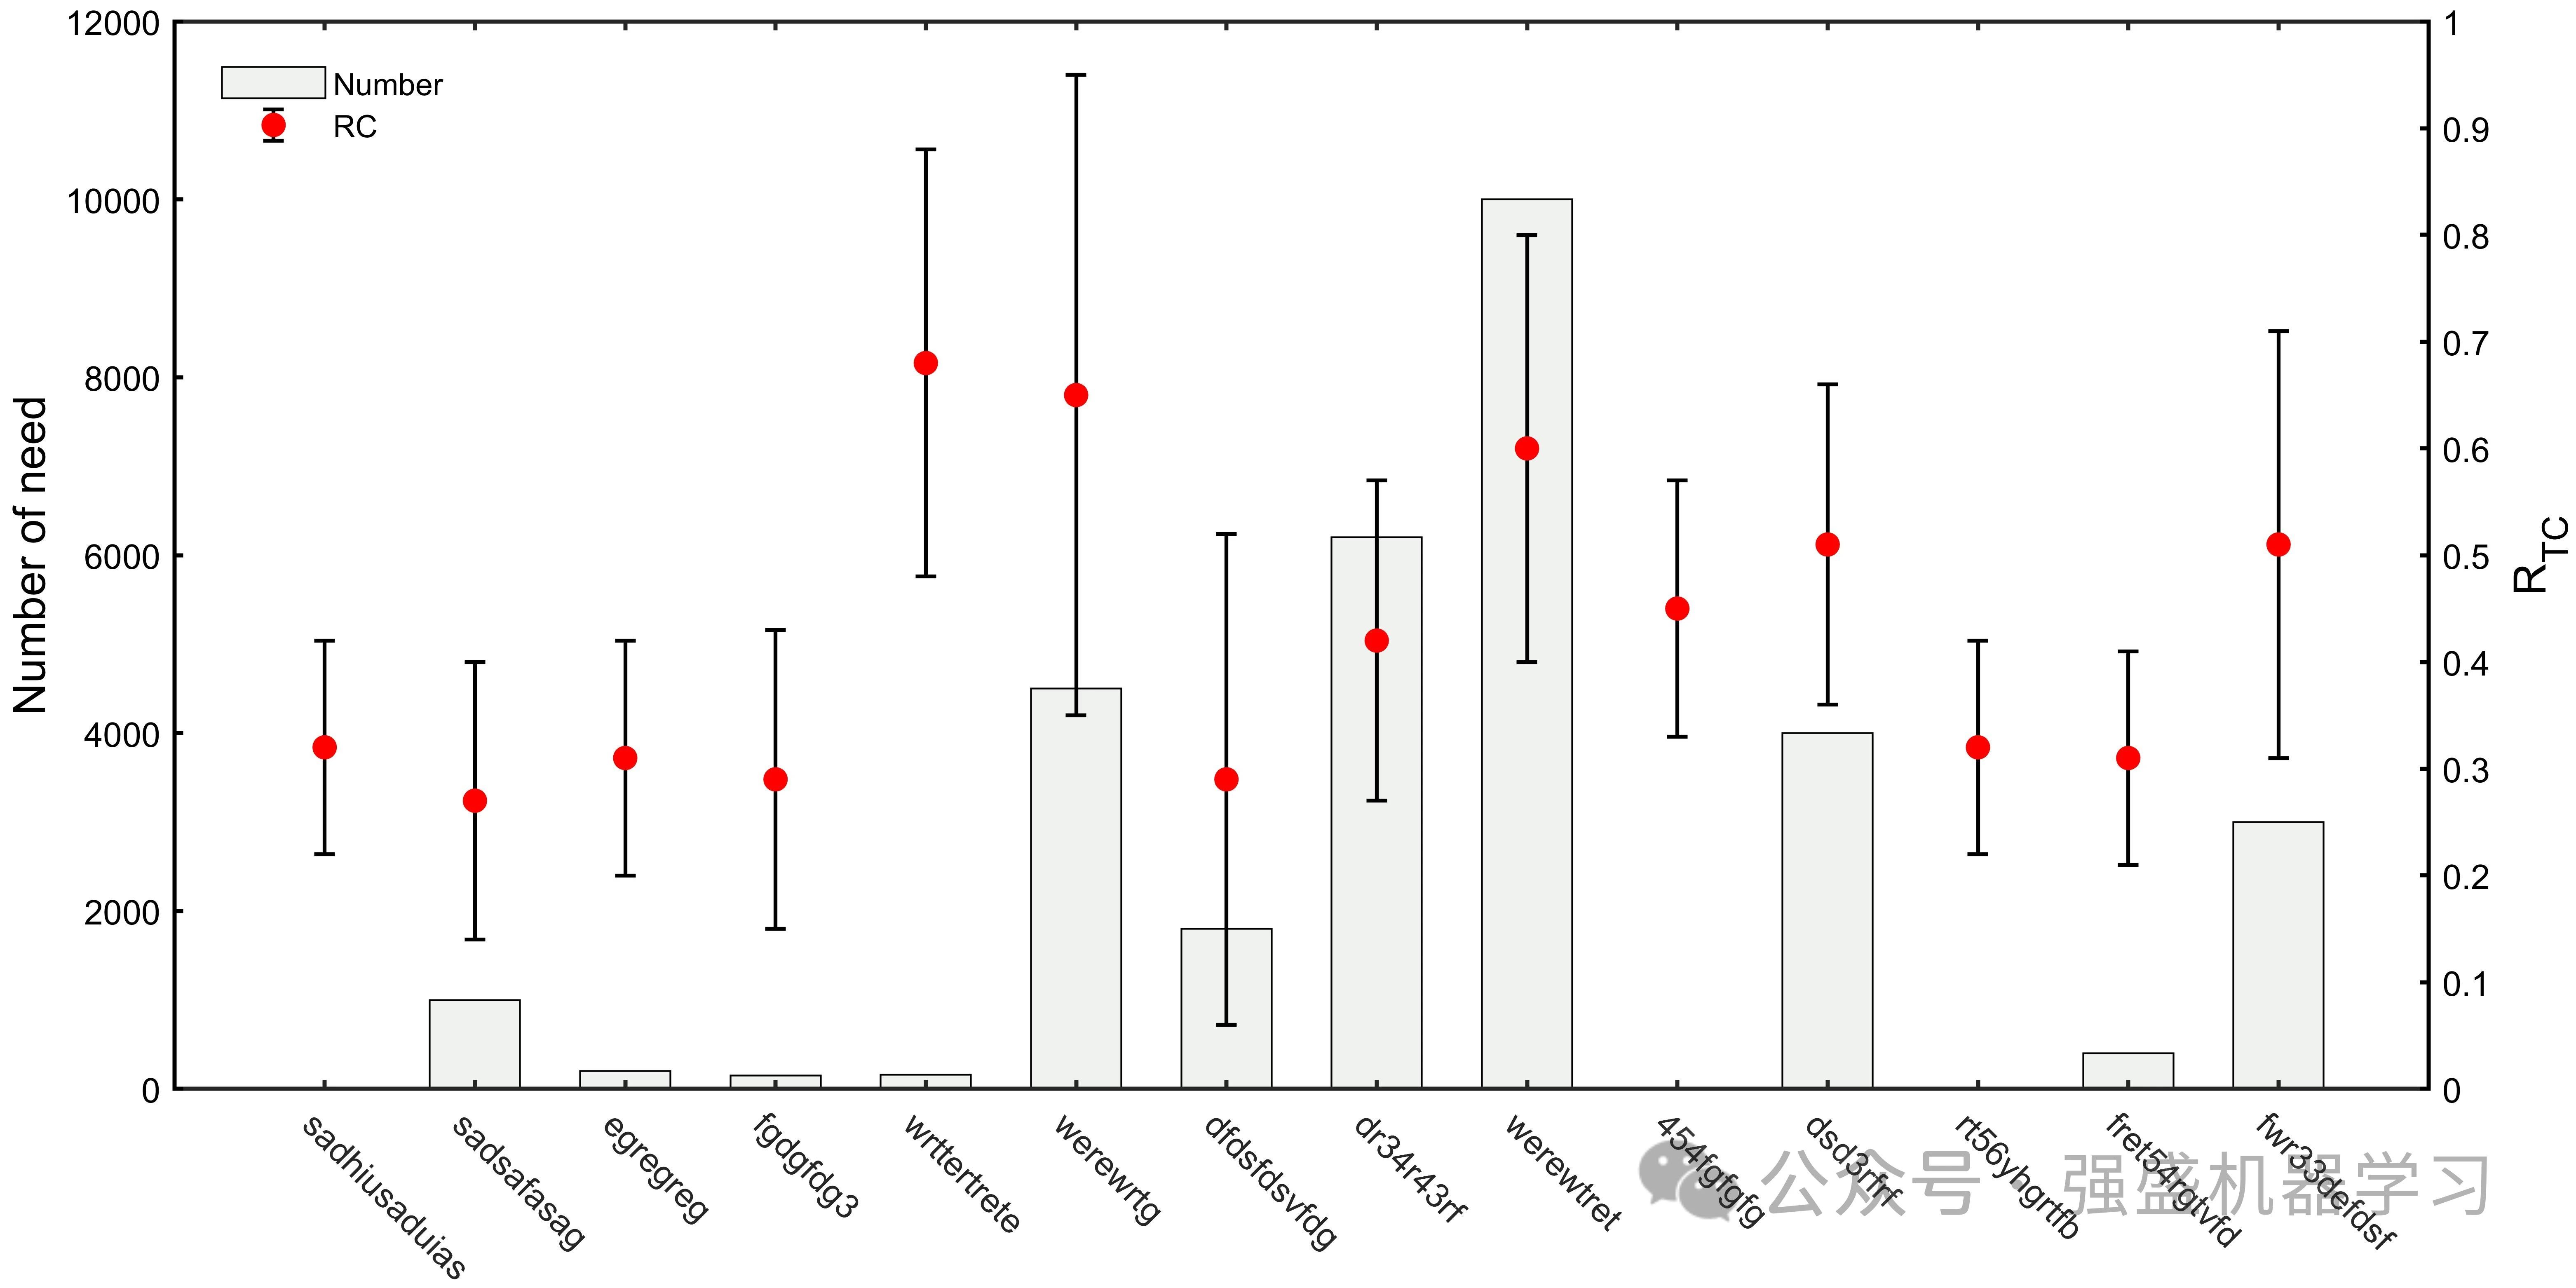
%% 柱状图与误差折线图数据准备
clc;
clear;
X = 1:14;
% 数据准备
data_zhu = [0,1000,200,150,160,4500,1800,6200,10000,0,4000,0,400,3000];% 柱状图数据
data_zhe = [0.32,0.27,0.31,0.29,0.68,0.65,0.29,0.42,0.6,0.45,0.51,0.32,0.31,0.51];
err_data =     [0.1,  0.13,0.11,0.14,0.2, 0.3,   0.23, 0.15,0.2,0.12, 0.15,0.1, 0.1, 0.2];
err_data_max = [0.15, 0.2, 0.18,0.21,0.25, 0.37, 0.29, 0.2, 0.27,0.18,0.19,0.2, 0.22, 0.26];
err_data_min = [0.06, 0.1,0.09, 0.11,0.14, 0.26, 0.2,  0.11,0.12,0.09,0.11,0.08, 0.07, 0.14];
err_data_up = err_data_max-err_data;
err_data_down = err_data-err_data_min;
%% 开始绘图(左轴为堆叠柱状图)
hFig = figure('color',[1 1 1]);
set(hFig, 'Position', [300 100 1000 500]);
yyaxis left;
set(gca,'ycolor',[0 0 0]);
%提取柱状图的颜色
color_zhu = [176,190,175]/255;
bar_figure = bar(X,data_zhu,0.6,'FaceAlpha',0.2);%用来修改透明度
set(bar_figure,'Facecolor',color_zhu);
hold on;
set(gca,'Ylim',[0 12000]);
ylabel('Number of need','Fontsize',13);
%% 开始绘制误差图
yyaxis right;
Y = data_zhe;
err_std = err_data;
set(gca,'ycolor',[0 0 0]);
e = errorbar(X,Y,err_data_up,err_data_down,'o','MarkerSize',6,'MarkerEdgeColor','r','MarkerFaceColor','r');
e.Color = 'k';%修改误差线的颜色
e.CapSize = 6; %修改误差线的宽度
e.LineWidth = 1.1;
ylabel('R_{T}_{C}','Fontsize',13);
%% 美化图像
set(gca,'XGrid', 'off', 'YGrid', 'off','TickDir', 'in', 'TickLength', [.003 .003]);
% 对X轴显示范围与横坐标显示设置
XX2 = {' ' ,'sadhiusaduias','sadsafasag','egregreg','fgdgfdg3','wrttertrete','werewrtg','dfdsfdsvfdg','dr34r43rf',...'werewtret','454fgfgfg','dsd3rfrf','rt56yhgrtfb','fret54rgtvfd','fwr33defdsf',' '};
set(gca,'Xlim',[0 15],'Xtick', [0:1:15],'Xticklabel',XX2,'XTickLabelRotation',-45);
h1 = legend('Number','RC' );
set(h1,'box','off','Location','Northwest');
set(gca,'Linewidth',1.2);
set(gca,'looseInset',[0 0 0 0]) %去掉图窗的多余白边
绘图代码7:实用柱状图
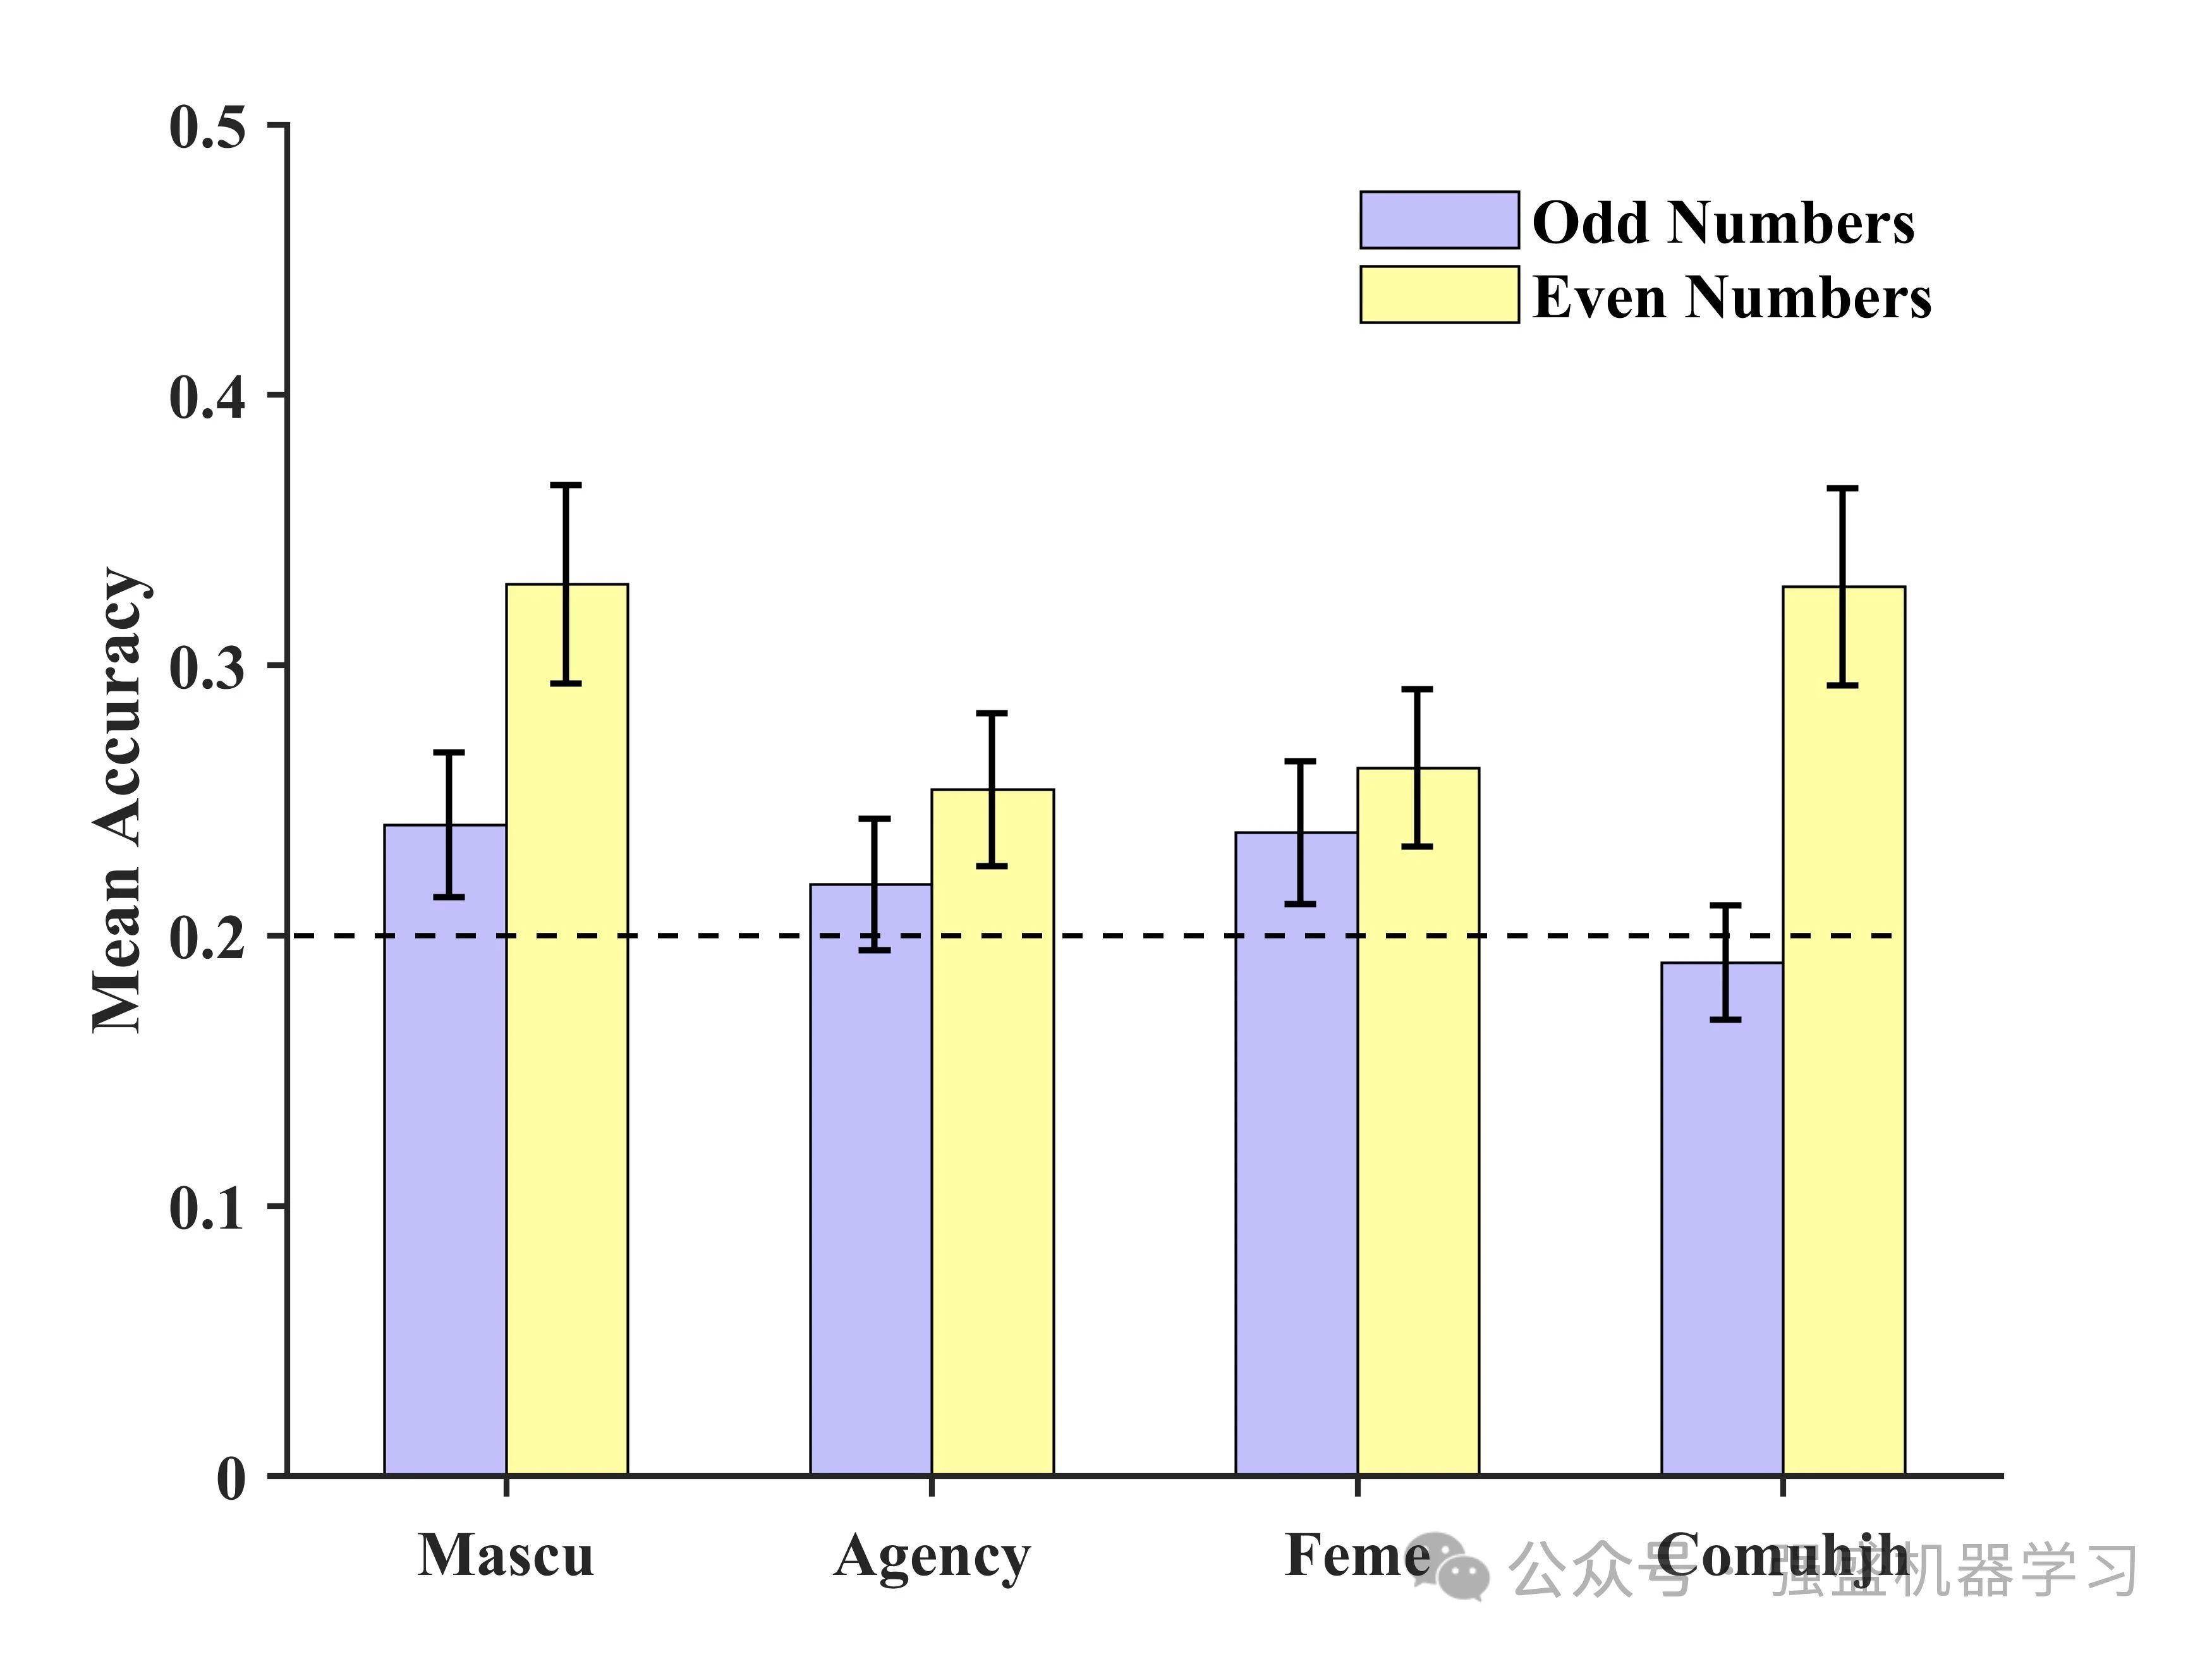
%% 数据准备
clc;
clear;
close all;
x = 1:5;
% dataset为4*2的矩阵,4代表4大组、2代表每组2个柱子
dataset = [0.241,0.33;0.219,0.254;0.238,0.262;0.19,0.329];
% 误差矩阵大小也是5*3
Mean = dataset; % 下方长度
Std = dataset/9; % 上方长度
%% 颜色定义 自己可以修改喜欢的颜色
C1 = [193 192 250]./255;
C2 =[254 253 163]./255;
% C1 = [0 191 196]./255;
% C2 =[248 118 109]./255;
%% 绘图
% 绘制初始柱状图
figure('color',[1 1 1]);
GO = bar(dataset,1,'EdgeColor','k');
GO(1).FaceColor = C1;
GO(2).FaceColor = C2;
% 添加误差棒
hold on;
errorbar([1+0.14  2+0.14  3+0.14  4+0.14 ],Mean(:,2),Std(:,2),'k','Linestyle','None','LineWidth', 1.2);
hold on;
errorbar([0.775+0.09 1.775+0.09  2.775+0.09  3.775+0.09 ],Mean(:,1),Std(:,1),'k','Linestyle','None','LineWidth', 1.2);
%% 参数调整
hold on;
ylabel('Mean Accuracy','Fontname','Times New Roman','FontSize',12,'FontWeight','bold');
% title('柱状图带误差棒','Fontname','微软雅黑');
% 坐标区调整
set(gca,'box','off');
% 重置box
set(gca,'XGrid', 'off', 'YGrid', 'on')
;
set(gca,'TickDir', 'out', 'TickLength', [.01 .01], 'XMinorTick', 'off', 'YMinorTick', 'off');
% 设置X轴属性
set(gca,'Xticklabel',{'Mascu' 'Agency' 'Feme' 'Comuhjh'});
% 设置Y轴属性
set(gca,'YTick', 0:0.1:1,'Ylim',[0 0.5]);
set(gca,'Linewidth',1.1);
set(gca,'XGrid','off','YGrid','off');
set(gca,'Fontname','Times New Roman','FontSize',12,'FontWeight','bold');
plot([0.5,4.3],[0.2,0.2],'LineStyle','--','Color','k','Linewidth',1);
% Legend 设置
hLegend = legend([GO(1),GO(2)],'Odd Numbers', 'Even Numbers','Location', 'northeast');
set(hLegend,'box','off');
set(hLegend,'FontName','Times New Roman','FontSize',12,'FontWeight','bold');免费完整代码获取
点击下方小卡片,后台回复关键字,不区分大小写:
绘图
其他更多需求或想要的代码均可点击下方小卡片后后台私信,看到后会秒回~



![[C++]18:set和map的使用](https://img-blog.csdnimg.cn/direct/f42e5f0bc9d34349a6ae4386cec324ff.png)


