Title
题目
Clinically applicable deep learning for diagnosis
and referral in retinal disease
临床应用的深度学习在视网膜疾病的诊断和转诊中的应用
01
文献速递介绍
诊断成像的数量和复杂性正在以比人类专家可用性更快的速度增加。人工智能在分类一些常见疾病的二维照片方面表现出了巨大的潜力,通常依赖于数百万张带注释的图像数据库。直到现在,在三维诊断扫描的实际临床路径中达到或超过专家临床医师性能的挑战仍未解决。在这里,我们将一种新颖的深度学习架构应用到了一组临床异质的来自一家主要眼科医院转诊患者的三维光学相干断层扫描中。我们证明了在仅训练了14,884次扫描后,我们的模型在制定转诊建议方面达到或超过了专家对一系列威胁视力的视网膜疾病的表现。此外,我们证明了我们的架构产生的组织分割作为一种设备独立的表示;当使用来自不同类型设备的组织分割时,转诊准确性得到了保持。我们的工作消除了在真实世界环境中跨多种病理学使用的先前障碍,而无需繁琐的训练数据要求。
Results
结果
Clinical application and AI architecture. We developed our architecture in the challenging context of OCT imaging for ophthalmology. We tested this approach for patient triage in a typical ophthalmology clinical referral pathway, comprising more than 50 common diagnoses for which OCT provides the definitive imaging modality (Supplementary Table 1). OCT is a threedimensional volumetric medical imaging technique analogous to three-dimensional ultrasonography but measuring the reflection of near-infrared light rather than sound waves at a resolution for living human tissue of ~5µm
临床应用和AI架构。我们在眼科OCT成像的具有挑战性的背景下开发了我们的架构。我们在一个典型的眼科临床转诊路径中测试了这种方法,该路径包括了超过50种常见诊断,其中OCT提供了确定性的成像模态(附录表1)。OCT是一种三维体积医学成像技术,类似于三维超声成像,但测量的是近红外光的反射,而不是声波,其分辨率为约5µm,适用于活体人组织。
Figure
图
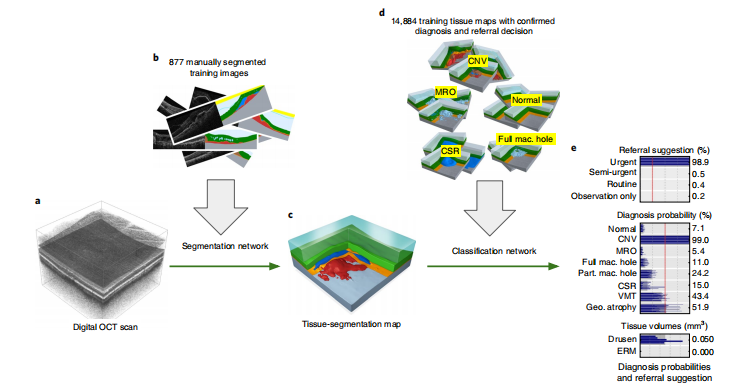
Fig. 1 | Our proposed AI framework. a, Raw retinal OCT scan (6 × 6 × 2.3 mm³ around the macula). b, Deep segmentation network, trained with manually segmented OCT scans. c, Resulting tissue segmentation map. d, Deep classification network, trained with tissue maps with confirmed diagnoses and optimal referral decisions. e, Predicted diagnosis probabilities and referral suggestions.
图1 | 我们提出的AI框架。a, 原始视网膜OCT扫描(在黄斑周围6×6×2.3mm³)。b, 深度分割网络,使用手动分割的OCT扫描进行训练。c, 结果组织分割地图。d, 深度分类网络,使用具有确认诊断和最佳转诊决策的组织地图进行训练。e, 预测的诊断概率和转诊建议。
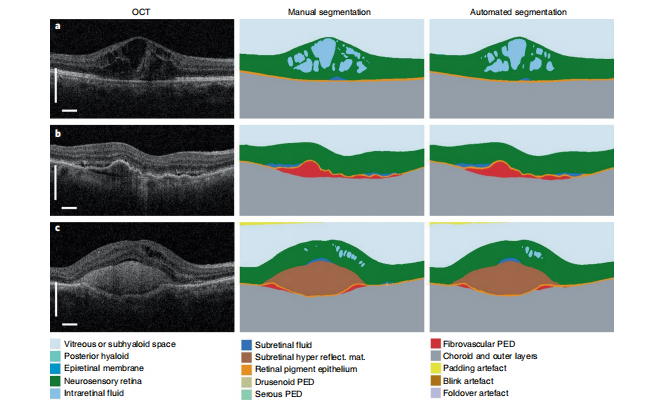
Fig. 2 | Results of the segmentation network. Three selected two-dimensional slices from the n= 224 OCT scans in the segmentation test set (left) with manual segmentation (middle) and automated segmentation (right; detailed color legend in Supplementary Table 2). a, A patient with diabetic macular edema. b, A patient with choroidal neovascularization resulting from age-related macular degeneration (AMD), demonstrating extensive fibrovascular pigment epithelium detachment and associated subretinal fluid. c, A patient with neovascular AMD with extensive subretinal hyperreflective material. Further examples of the variation of pathology with model segmentation and diagnostic performance can be found in Supplementary Videos 1–9. In all examples the classification network predicted the correct diagnosis. Scale bars, 0.5 mm.
图2 | 分割网络的结果。分割测试集中224个OCT扫描的三个选定的二维切片(左)与手动分割(中)和自动分割(右;详细的颜色图例见附录表2)。a, 患有糖尿病性黄斑水肿的患者。b, 因年龄相关性黄斑变性(AMD)引起的脉络膜新生血管,显示广泛的纤维血管素上皮脱离和相关的视网膜下液体。c, 患有新生血管型AMD,具有大量视网膜下高反射物质。在所有示例中,分类网络预测了正确的诊断。比例尺,0.5mm。
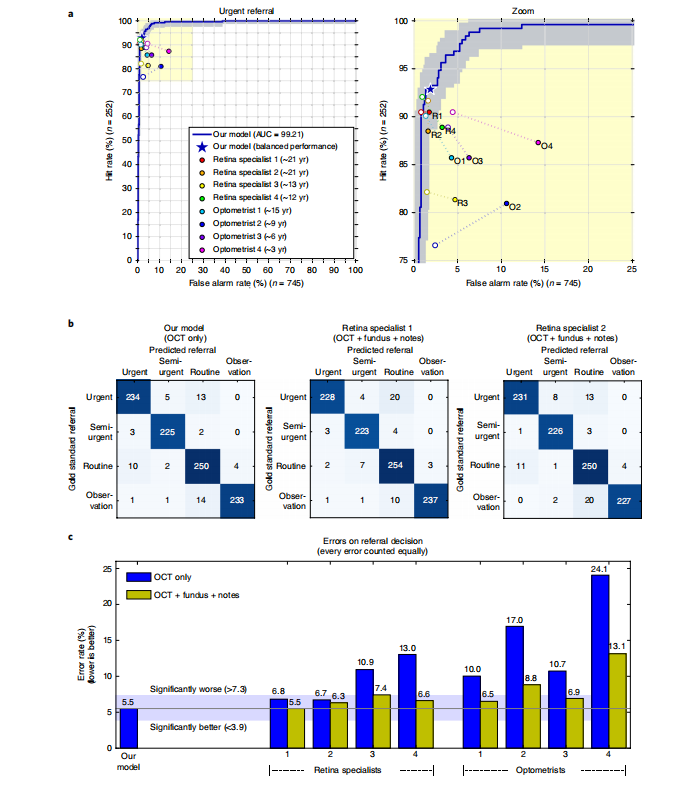
Fig. 3 | Results on the patient referral decision. Performance on an independent test set of n= 997 patients (252 urgent, 230 semi-urgent, 266 routine, 249 observation only). a, ROC diagram for urgent referral (for choroidal neovascularization (CNV)) versus all other referrals. The blue ROC curve is created by sweeping a threshold over the predicted probability of a particular clinical diagnosis. Points outside the light blue area correspond to a significantly different performance (95% confidence level, using a two-sided exact binomial test). The asterisk denotes the performance of our model in the ‘balanced performance’ setting. Filled markers denote experts’ performance using OCT only; empty markers denote their performance using OCT, fundus image and summary notes. Dashed lines connect the two performance points of each expert. b, Confusion matrices with patient numbers for referral decision for our framework and the two best retina specialists. These show the number of patients for each combination of gold standard decision and predicted decision. The numbers of correct decisions are found on the diagonal. Wrong decisions due to overdiagnosis are in the bottom-left triangle, and wrong decisions due to underdiagnosis are in the top-right triangle. c, Total error rate (1 − accuracy) on referral decision. Values outside the light-blue area (3.9–7.3%) are significantly different (95% confidence interval, using a two-sided exact binomial test) to the framework performance (5.5%). AUC, area under curve.
图3 | 患者转诊决策结果。对包括252例紧急、230例半紧急、266例常规和249例仅观察的独立测试集中的997名患者的性能进行评估。a, 对于紧急转诊(用于脉络膜新生血管(CNV))与所有其他转诊的ROC图。蓝色ROC曲线通过在特定临床诊断的预测概率上扫描阈值而创建。在浅蓝色区域之外的点对应于显着不同的性能(使用双侧精确的二项检验,95%置信水平)。星号表示我们模型在“平衡性能”设置下的性能。实心标记表示专家仅使用OCT的性能;空心标记表示他们使用OCT、眼底图像和摘要笔记的性能。虚线连接了每位专家的两个性能点。b, 转诊决策的混淆矩阵及患者数量,显示了每个标准决策和预测决策的患者数量。对角线上是正确决策的数量。由于过度诊断而导致的错误决策在左下三角形中,由于欠诊而导致的错误决策在右上三角形中。c, 转诊决策的总错误率(1-准确率)。在浅蓝色区域之外的值(3.9-7.3%)与框架性能(5.5%)显着不同(使用双侧精确的二项检验,95%置信区间)。AUC,曲线下面积。
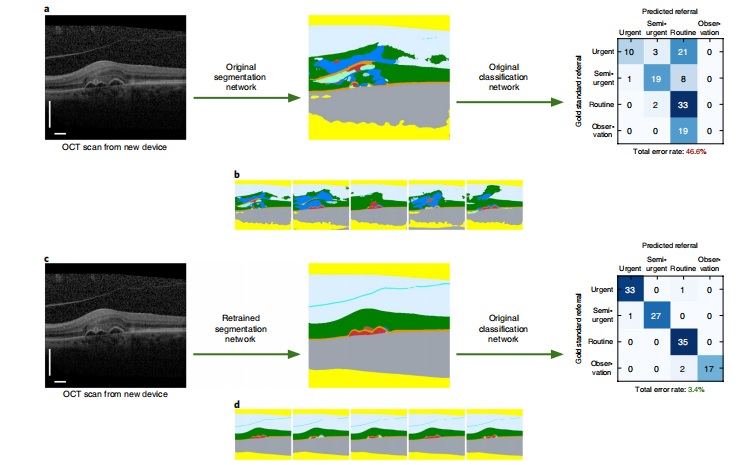
Fig. 4 | Generalization to a new scanning device type. a, Low performance of original network on OCT scans from the new device type 2. Left, the selected slice shows the different appearance of structures in device type 2. Middle, a poor quality segmentation map created with our original segmentation network (color legend in Supplementary Table 2). Right, resulting performance on a new test set of n= 116 patients. The confusion matrix shows patient numbers for the referral suggestion. b, All five segmentation hypotheses from our original network. The strong variations show the large uncertainty. c, High performance was attained on the device type 2 test set (n= 116) after retraining the segmentation network with OCT scans from device type 1 and device type 2. The classification network is unchanged. d, All five segmentation hypotheses from the retrained segmentation network. The network is confident in the interpretation of most structures, and just highlights the ambiguities in the sub-retinal pigment epithelium (RPE) space. Scale bars: 0.5 mm.
图4 | 对新扫描设备类型的泛化性能。a, 原始网络在来自新设备类型2的OCT扫描上的低性能。左边,选定的切片显示了设备类型2中结构的不同外观。中间,使用我们的原始分割网络创建的质量差的分割地图(颜色图例见附录表2)。右边,对新测试集(n=116名患者)的结果。混淆矩阵显示了转诊建议的患者数量。b, 我们原始网络的所有五个分割假设。强烈的变化显示了大的不确定性。c, 通过使用设备类型1和设备类型2的OCT扫描重新训练分割网络,在设备类型2测试集(n=116)上实现了高性能。分类网络保持不变。d, 重新训练的分割网络的所有五个分割假设。网络对大多数结构的解释都很自信,只是突出了亚视网膜色素上皮(RPE)空间的不确定性。比例尺:0.5mm。

Fig. 5 | Visualization of the segmentation results as thickness maps. a, The average intensity projection of the OCT scan along A-scan direction (frontal view of the eye) is overlaid with a thickness map of the fibrovascular pigment epithelium detachment (PED, red segment). b, Screenshot from our OCT viewer. First row (left), referral suggestion, tissue volumes and diagnosis probabilities. The highlighted bars correspond to the selected segmentation model. First–third rows, thickness maps of the 10 relevant tissue types from segmentation model instance 2. The two healthy tissue types (high level retina and RPE) are displayed in a black–blue–green–brown–white color map, the pathological tissues (all others) are displayed as overlay on a projection of the raw OCT scan. The thin white line indicates the position of slice 80. Fourth row, slice 80 from the OCT scan and the segmentation map from segmentation model instance 2. Detailed tissue legend in Supplementary Table 2. The slice and model instance can be interactively selected .
图5 | 分割结果的厚度图可视化。a, 沿着A扫描方向(眼睛的前视图)的OCT扫描的平均强度投影与纤维血管素上皮脱离(PED,红色段)的厚度图叠加在一起。b, 我们OCT查看器的屏幕截图。第一行(左侧),转诊建议、组织体积和诊断概率。高亮的条形对应于所选的分割模型。第一至第三行,来自分割模型实例2的10种相关组织类型的厚度图。两种健康组织类型(高级视网膜和RPE)以黑-蓝-绿-棕-白色图显示,病理组织(其他所有组织)显示为覆盖在原始OCT扫描投影上。细白线表示切片80的位置。第四行,来自OCT扫描的切片80和分割模型实例2的分割图。详细的组织图例请参见附录表2。切片和模型实例可以交互式选择。
Table
表

Table 1 | Number of training scans and achieved performance on the two device types
表1 | 两种设备类型上的训练扫描数量和达到的性能


![[matlab]折线图之多条折线如何绘制实心圆作为标记点](https://img-blog.csdnimg.cn/img_convert/2d927516fb3bc776d6a495772976fe68.png)