1. 简单图像处理
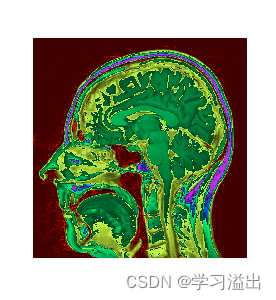
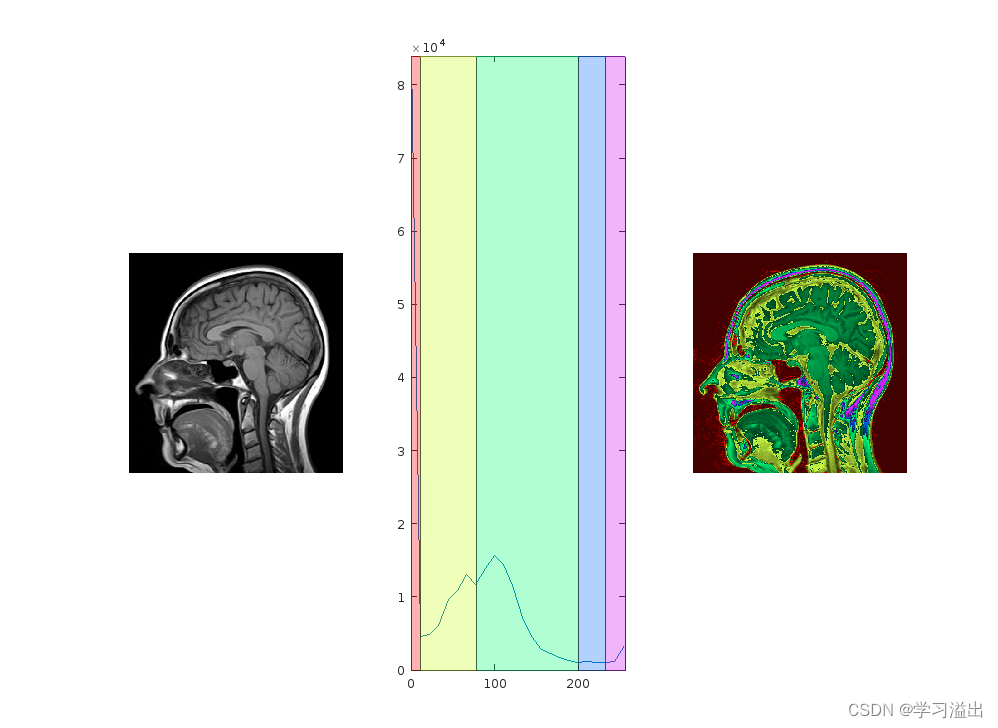
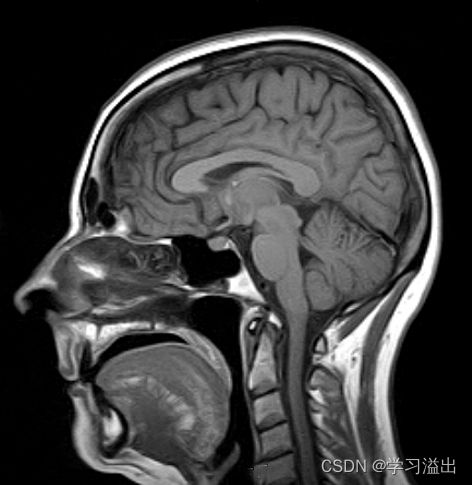
加载图像 Brain.jpg,使用直方图和颜色分割成区域这些区域有不同的颜色。 这是一个更高级的问题,有多个解决它的方法。
例如,您可以计算具有特定数字的图像的直方图(例如 16 - 32),找到直方图中最小值的位置(参见,例如,islocalmin)并对最小值之间的强度区域应用不同的颜色。这可以通过将强度值作为颜色查找表的索引来完成(例如 hsv 生成)并将强度值重新映射到此类(请参阅 ind2rgb)。 您可以还可以通过灰度强度来缩放颜色的强度。
2. MATLAB 源码
% Load and show image
im = imread('brain.jpg');
im = rgb2gray(im);
figure(1);
clf;
subplot(1,3,1);
imshow(im);% Histogram
bins = 24;
subplot(1,3,2);
[counts,idx] = imhist(im,bins);
plot(idx,counts);
axis tight;
% Find minima and make sure they are integers
minima = round(idx(islocalmin(counts))');
xline(minima);% Color regions by mapping greyscale to colormap indices
colors = hsv(numel(minima)+1); % HSV colormap for base-color for region (over hue values only)
cc = 1;
p = 0;
map = zeros(256,3);
for l = [minima, 256] % cover index (intensity) ranges from p to l, including the last one to 256cidx = (p+1):l;for k = cidx % Loop for simplicity (instead of matrix operation)%map(k,:) = colors(cc,:);         % No scaling w.r.t original itensity%map(k,:) = colors(cc,:) * k/256; % Linearly scale color value w.r.t. original intensitymap(k,:) = colors(cc,:) * (0.25 + (k-p-1)/(l-p-1)*0.75); % Different color itensity scalingendp = l;cc = cc + 1;
end
imc = ind2rgb(im,map);
subplot(1,3,3);
imshow(imc);% Show ranges in histogram by overlaying colors (could be integrated in above loop)
subplot(1,3,2);
y1 = 0;
y2 = max(counts);
cc = 1;
p = 0;
for l = [minima,256]h = rectangle('Position', [p, 0, l-p, y2], ...'FaceColor', [colors(cc,:),0.3], ...'EdgeColor', [colors(cc,:),0.3]);p = l;cc = cc + 1;
end
3. 输出结果
脑切片图像分割结果
