1.示例
criterion可以是信息熵,entropy,可以是基尼系数gini
# -*-coding:utf-8-*-
from sklearn import tree
from sklearn.datasets import load_wine
from sklearn.model_selection import train_test_split
wine=load_wine()# print ( wine.feature_names )
#(178, 13)
print(wine.data.shape)Xtrain,Xtest,Ytrain,Ytest=train_test_split(wine.data,wine.target,test_size=0.3)#random_state=30:输入任意整数,会一直长同一棵树,让模型稳定下来
clf=tree.DecisionTreeClassifier(criterion="entropy",random_state=30,splitter="best")
# clf=tree.DecisionTreeClassifier(criterion="entropy")
clf=clf.fit(Xtrain,Ytrain)
#返回预测准确度accuracy
score=clf.score(Xtest,Ytest)print( score )import graphviz
dot_data=tree.export_graphviz(clf,feature_names=wine.feature_names,class_names=["wine1","wine2","wine3"],filled=True,rounded=True)
graph=graphviz.Source(dot_data)
#生成pdf文件
graph.render(view=True, format="pdf", filename="tree_pdf")
print ( graph )
#feature_importances_:每个特征在决策树中的重要成都
print(clf.feature_importances_)
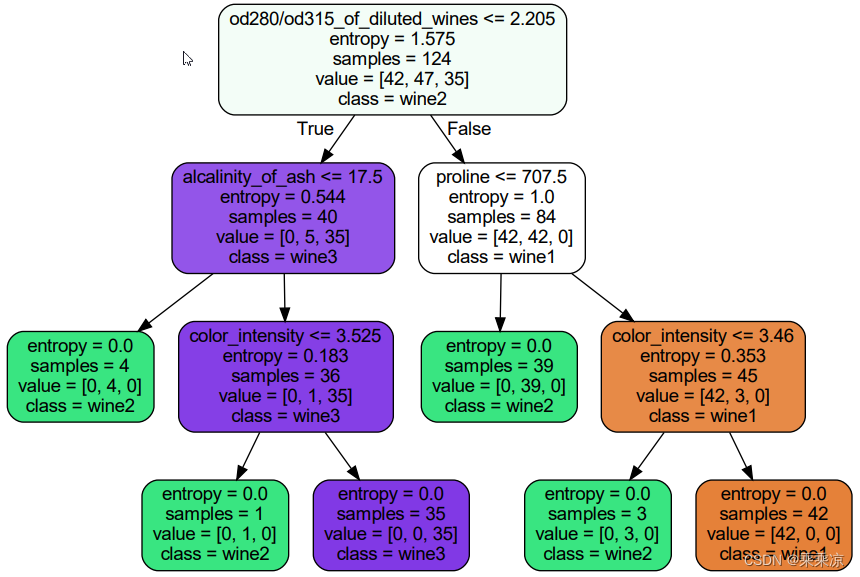
print ( [*zip(wine.feature_names,clf.feature_importances_)] )决策树生成的pdf
2.示例
max_depth:这参数用来控制决策树的最大深度。以下示例,构建1~10深度的决策时,看哪个深度的决策树的精确率(score)高
# -*-coding:utf-8-*-
from sklearn import tree
from sklearn.datasets import load_wine
from sklearn.model_selection import train_test_split
import matplotlib.pyplot as pltplt.switch_backend("TkAgg")wine=load_wine()# print ( wine.feature_names )
#(178, 13)
print(wine.data.shape)import pandas as pd
# print (pd.concat([pd.DataFrame(wine.data),pd.DataFrame(wine.target)],axis=1))
#所有的train,test必须是二维矩阵
Xtrain,Xtest,Ytrain,Ytest=train_test_split(wine.data,wine.target,test_size=0.3)test=[]
bestScore=-1
bestClf=None
for i in range(10):clf=tree.DecisionTreeClassifier(max_depth=i+1,criterion="entropy",random_state=30,splitter="random")clf=clf.fit(Xtrain,Ytrain)score=clf.score(Xtest,Ytest)test.append(score)if score>bestScore:bestScore=scorebestClf=clf
print(test)
print(test.index(bestScore))
#predict返回每个测试样本的分类/回归结果
predicted=bestClf.predict(Xtest)
print(predicted)#返回每个测试样本的叶子节点的索引
leaf=bestClf.apply(Xtest)
print(leaf)plt.plot(range(1,11),test,color="red",label="max_depth")
plt.legend()
plt.show()
结果:
(178, 13)
[0.5555555555555556, 0.8148148148148148, 0.9444444444444444, 0.9259259259259259, 0.8518518518518519, 0.8333333333333334, 0.8333333333333334, 0.8333333333333334, 0.8333333333333334, 0.8333333333333334]
2
[0 1 0 1 2 0 1 1 1 2 2 0 0 2 0 1 1 0 0 0 0 1 1 0 2 1 0 2 2 1 2 1 1 1 1 0 12 2 0 1 1 2 0 2 1 1 0 1 1 2 1 2 2]
[12  7 12 11  3 12  7  7  4  3  3 12 12  3 12  9  7 12 12 12 12  7  9 123  9 12  3  3  4  3  4  7  7  7 12  7  3  3 12  9  9  3 12  3  7  7 127  7  3  7  3  3]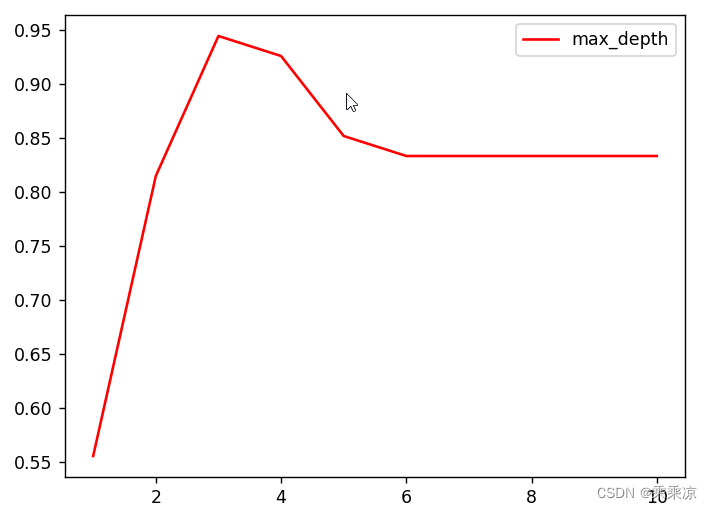
3.交叉熵验证的示例
# -*-coding:utf-8-*-
from sklearn.model_selection import cross_val_score
from sklearn.tree import DecisionTreeRegressor
import sklearn
from sklearn.datasets import fetch_california_housinghousing=fetch_california_housing()
# print(housing)
# print(housing.data)
# print(housing.target)regressor=DecisionTreeRegressor(random_state=0)#cv=10,10次交叉验证,default:cv=5
#scoring="neg_mean_squared_error",评价指标是负的均方误差
cross_res=cross_val_score(regressor,housing.data,housing.target,scoring="neg_mean_squared_error",cv=10)
print(cross_res)
[-1.30551334 -0.78405711 -0.72809865 -0.50413232 -0.79683323 -0.83698199-0.56591889 -1.03621067 -1.02786488 -0.51371889]4.Titanic生存者预测
数据来源:
Titanic - Machine Learning from Disaster | Kaggle
数据预处理
读取数据
import pandas as pd
from sklearn.tree import DecisionTreeClassifier
import matplotlib.pyplot as plt
from sklearn.model_selection import GridSearchCV
#---------设置pd,在pycharm中显示完全表格-------
pd.set_option('display.max_columns', 1000)
pd.set_option('display.width', 1000)
pd.set_option('display.max_colwidth', 1000)
#----------------------------------------
data=pd.read_csv("./data.csv")
print (data.head(5))
print(data.info())
PassengerId Survived Pclass Name Sex Age SibSp Parch Ticket Fare Cabin Embarked
0 1 0 3 Braund, Mr. Owen Harris male 22.0 1 0 A/5 21171 7.2500 NaN S
1 2 1 1 Cumings, Mrs. John Bradley (Florence Briggs Thayer) female 38.0 1 0 PC 17599 71.2833 C85 C
2 3 1 3 Heikkinen, Miss. Laina female 26.0 0 0 STON/O2. 3101282 7.9250 NaN S
3 4 1 1 Futrelle, Mrs. Jacques Heath (Lily May Peel) female 35.0 1 0 113803 53.1000 C123 S
4 5 0 3 Allen, Mr. William Henry male 35.0 0 0 373450 8.0500 NaN S
<class 'pandas.core.frame.DataFrame'>
RangeIndex: 891 entries, 0 to 890
Data columns (total 12 columns):# Column Non-Null Count Dtype
--- ------ -------------- ----- 0 PassengerId 891 non-null int64 1 Survived 891 non-null int64 2 Pclass 891 non-null int64 3 Name 891 non-null object 4 Sex 891 non-null object 5 Age 714 non-null float646 SibSp 891 non-null int64 7 Parch 891 non-null int64 8 Ticket 891 non-null object 9 Fare 891 non-null float6410 Cabin 204 non-null object 11 Embarked 889 non-null object
dtypes: float64(2), int64(5), object(5)
memory usage: 83.7+ KB
NoneProcess finished with exit code 0
筛选特征
data.drop(["Cabin","Name","Ticket"],inplace=True,axis=1)
print(data.head())
print(data.info())
PassengerId Survived Pclass Sex Age SibSp Parch Fare Embarked
0 1 0 3 male 22.0 1 0 7.2500 S
1 2 1 1 female 38.0 1 0 71.2833 C
2 3 1 3 female 26.0 0 0 7.9250 S
3 4 1 1 female 35.0 1 0 53.1000 S
4 5 0 3 male 35.0 0 0 8.0500 S
<class 'pandas.core.frame.DataFrame'>
RangeIndex: 891 entries, 0 to 890
Data columns (total 9 columns):# Column Non-Null Count Dtype
--- ------ -------------- ----- 0 PassengerId 891 non-null int64 1 Survived 891 non-null int64 2 Pclass 891 non-null int64 3 Sex 891 non-null object 4 Age 714 non-null float645 SibSp 891 non-null int64 6 Parch 891 non-null int64 7 Fare 891 non-null float648 Embarked 889 non-null object
dtypes: float64(2), int64(5), object(2)
memory usage: 62.8+ KB
None
处理缺失值
#年龄用均值填补
data["Age"]=data["Age"].fillna(data["Age"].mean())
print(data.info())
<class 'pandas.core.frame.DataFrame'>
RangeIndex: 891 entries, 0 to 890
Data columns (total 9 columns):# Column Non-Null Count Dtype
--- ------ -------------- ----- 0 PassengerId 891 non-null int64 1 Survived 891 non-null int64 2 Pclass 891 non-null int64 3 Sex 891 non-null object 4 Age 891 non-null float645 SibSp 891 non-null int64 6 Parch 891 non-null int64 7 Fare 891 non-null float648 Embarked 889 non-null object
dtypes: float64(2), int64(5), object(2)
memory usage: 62.8+ KB
None
#删除有缺失值的行,Embarked缺了两行
data=data.dropna()
print(data.info())
<class 'pandas.core.frame.DataFrame'>
Int64Index: 889 entries, 0 to 890
Data columns (total 9 columns):# Column Non-Null Count Dtype
--- ------ -------------- ----- 0 PassengerId 889 non-null int64 1 Survived 889 non-null int64 2 Pclass 889 non-null int64 3 Sex 889 non-null object 4 Age 889 non-null float645 SibSp 889 non-null int64 6 Parch 889 non-null int64 7 Fare 889 non-null float648 Embarked 889 non-null object
dtypes: float64(2), int64(5), object(2)
memory usage: 69.5+ KB
None
处理非数值的列
查看非数值列的所有值
print(data["Embarked"].unique())
print(data["Sex"].unique())#------------结果如下----------
['S' 'C' 'Q']
['male' 'female']
labels=data["Embarked"].unique().tolist()
#x代表data[Embarked]的每一行的值,S-->0,C-->1,Q-->2
data["Embarked"]=data["Embarked"].apply(lambda x:labels.index(x))#把条件为True的转为int行
#也可以这样写:data.loc[:,"Sex"]=(data["Sex"]=="male").astype("int")
#male-->0,female-->1
data["Sex"]=(data["Sex"]=="male").astype("int")提取数据
x=data.iloc[:, data.columns!="Survived"]
y=data.iloc[:,data.columns=="Survived"]#Xtrain:(622, 8)
#划分数据集和测试集
from sklearn.model_selection import train_test_split
Xtrain,Xtest,Ytrain,Ytest=train_test_split(x,y,test_size=0.3)#把索引变为从0~622
for i in [Xtrain,Xtest,Ytrain,Ytest]:i.index=range(i.shape[0])
第一种方法构建决策树
# clf=DecisionTreeClassifier(random_state=25)
# clf=clf.fit(Xtrain,Ytrain)
# score=clf.score(Xtest,Ytest)
# print(score)
from sklearn.model_selection import cross_val_score
# clf=DecisionTreeClassifier(random_state=25)
# score=cross_val_score(clf,x,y,cv=10).mean()
# print(score)tr=[]
te=[]
for i in range(10):clf=DecisionTreeClassifier(random_state=25,max_depth=i+1,criterion="entropy")clf=clf.fit(Xtrain,Ytrain)score_tr=clf.score(Xtrain,Ytrain)score_te=cross_val_score(clf,x,y,cv=10).mean()tr.append(score_tr)te.append(score_te)
print(max(te))
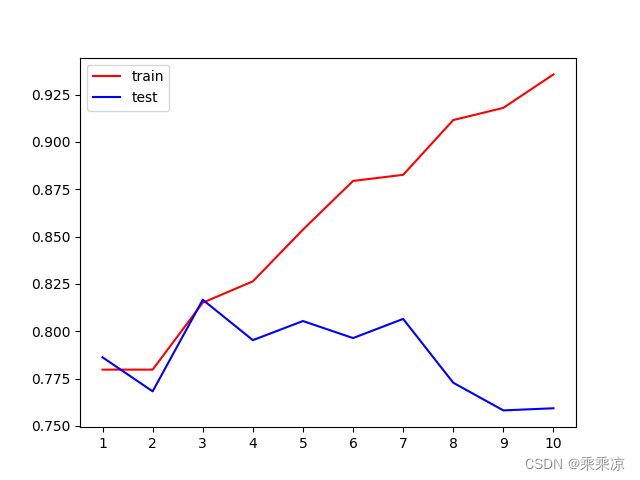
plt.plot(range(1,11),tr,color="red",label="train")
plt.plot(range(1,11),te,color="blue",label="test")
#1~10全部显示
plt.xticks(range(1,11))
plt.legend()
plt.show()不同深度的决策树的测试集和训练集的表现
第二种方法构建决策树
import pandas as pd
from sklearn.tree import DecisionTreeClassifier
import matplotlib.pyplot as plt
plt.switch_backend("TkAgg")
from sklearn.model_selection import GridSearchCV
import numpy as np#---------设置pd,在pycharm中显示完全表格-------
pd.set_option('display.max_columns', 1000)
pd.set_option('display.width', 1000)
pd.set_option('display.max_colwidth', 1000)
#----------------------------------------
data=pd.read_csv("./data.csv")
# print (data.head(5))
# print(data.info())#去掉姓名、Cabin、票号的特征
data.drop(["Cabin","Name","Ticket"],inplace=True,axis=1)
# print(data.head())
# print(data.info())#处理缺失值
#年龄用均值填补
data["Age"]=data["Age"].fillna(data["Age"].mean())
# print(data.info())#删除有缺失值的行,Embarked缺了两行,所有的数据去掉不完整的行
data=data.dropna()
# print(data.info())# print(data["Embarked"].unique())
# print(data["Sex"].unique())labels=data["Embarked"].unique().tolist()
#x代表data[Embarked]的每一行的值,S-->0,C-->1,Q-->2
data["Embarked"]=data["Embarked"].apply(lambda x:labels.index(x))#把条件为True的转为int行
#也可以这样写:data.loc[:,"Sex"]=(data["Sex"]=="male").astype("int")
#male-->0,female-->1
data["Sex"]=(data["Sex"]=="male").astype("int")x=data.iloc[:, data.columns!="Survived"]
y=data.iloc[:,data.columns=="Survived"]#Xtrain:(622, 8)
#划分数据集和测试集
from sklearn.model_selection import train_test_split
Xtrain,Xtest,Ytrain,Ytest=train_test_split(x,y,test_size=0.3)#把索引变为从0~622
for i in [Xtrain,Xtest,Ytrain,Ytest]:i.index=range(i.shape[0])from sklearn.model_selection import cross_val_scoreclf=DecisionTreeClassifier(random_state=25)
#GridSearchCV:满足fit,score,交叉验证三个功能
#parameters:一串参数和这些参数对应的,我们希望网格搜索来搜索对应的参数的取值范围
parameters={"criterion":("gini","entropy"),"splitter":("best","random"),"max_depth":[*range(1,10)],"min_samples_leaf":[*range(1,50,5)],"min_impurity_decrease":[*np.linspace(0,0.5,20)]
}
GS=GridSearchCV(clf,parameters,cv=10)
gs=GS.fit(Xtrain,Ytrain)#从输入的参数和参数取值中,返回最佳组合
print(gs.best_params_)#网格搜索后的模型的评判标准
print(gs.best_score_)
{'criterion': 'entropy', 'max_depth': 3, 'min_impurity_decrease': 0.0, 'min_samples_leaf': 1, 'splitter': 'best'}
0.8297235023041475这种方法构建的决策树的准确率比第一种的还低


![[免费在线] 将 PDF 转换为 Excel 或 Excel 转换为 PDF | 5 工具](https://img-blog.csdnimg.cn/img_convert/ada8fe280f90ec4d4a4a9f050c4e5f53.png)